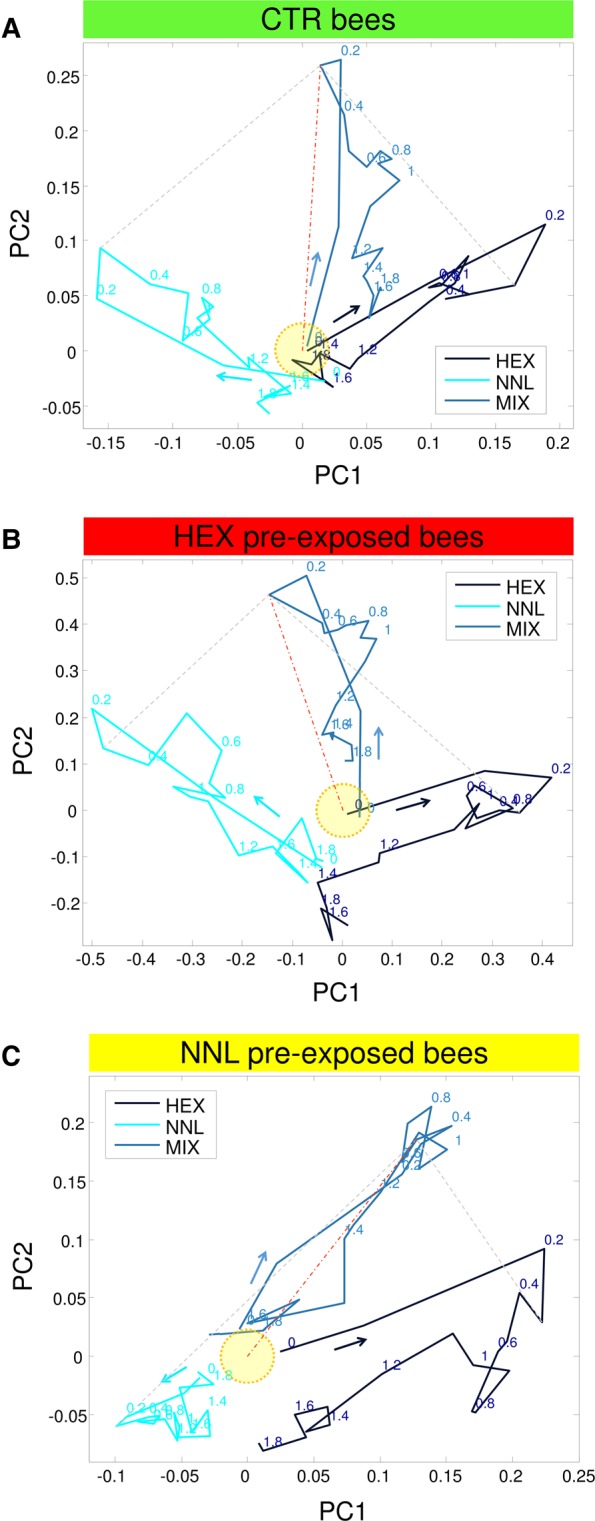
Figure 2.

Activation dynamics during the presentation of three odor stimuli in the principal component coordinate system (1-sec stimulus and 1-sec post-stimulus) for the three groups: (A) control (CTR) bees, (B) hexanol (HEX) preexposed bees, and (C) nonanol (NNL) preexposed bees. Activation vectors represent all measured glomeruli in a given treatment group. HEX activation vector is shown in blue, NNL in cyan, and their binary mixture (MIX) in light blue. The origin, marked by a yellow circle, corresponds to baseline activation. Arrows show the temporal axis; numbers indicate time after stimulus onset in seconds. Dashed gray lines connect the 300 msec time-points, which are the points of maximal odor separation. A dotted and dashed orange line connects the origin with the binary mixture 300 msec time-point.
