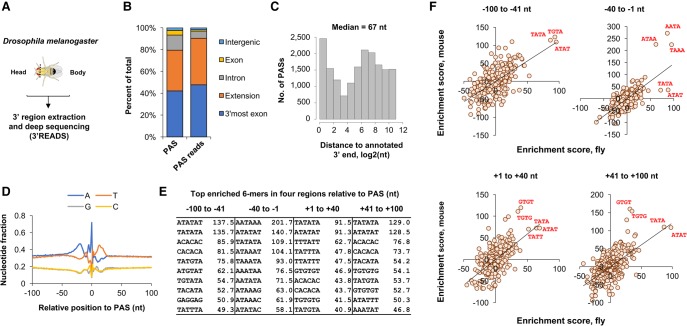
FIGURE 1.
PASs in the Drosophila melanogaster genome. (A) Experimental design. RNA isolated from Drosophila head or body was subjected to 3′ region extraction and deep sequencing (3′READS) analysis for identification of PAS and analysis of APA isoform abundance. (B) Distribution of PASs and PAS reads in the Drosophila genome. (C) Extension of annotated 3′ ends by 3′READS data (see Materials and Methods for details). A total of 16,908 PASs were found to be in the extended region. The median extension size is indicated. (D) Nucleotide profile around fly PASs. (E) Top 10 enriched 6-mers around the fly PAS. Four regions around the PAS were analyzed, as indicated. Numbers are enrichment scores based on comparison of observed sequences with expected sequences (see Materials and Methods for details). (F) Comparison of 4-mer enrichment between mouse and fly in four regions surrounding the PAS. Values are enrichment score as in E. Several top 4-mers in each graph are highlighted to indicate consistency or distinction between PAS cis-elements in fly and mouse.

