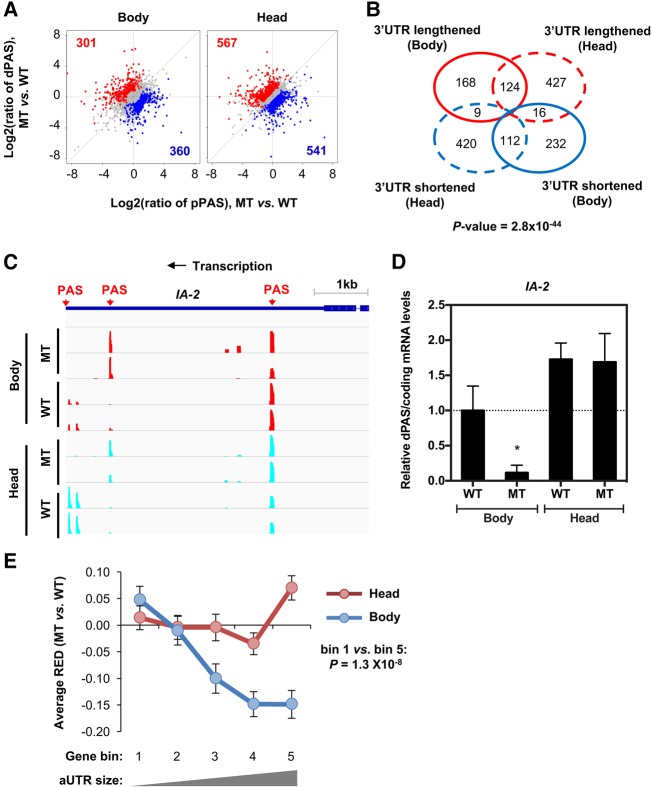
FIGURE 5.
3′UTR-APA regulation in a fly mutant with a slower RNAPII elongation. (A) Scatter plots comparing 3′UTR-APA isoform abundance between wild-type (WT; w1118) and mutant (MT; RpII215) in body (left) and head (right), as in Figure 3B. (B) Venn diagram comparing 3′UTR-APA changes between WT and MT in body vs. in head. (C) UCSC snapshot of 3′READS for IA-2, showing that dPAS expression is decreased in mutant body in comparison to the wild-type body. Two replicates are shown. (D) Ratio of dPAS/coding relative mRNA expression levels for IA-2 in wild-type (WT) and mutant (MT) bodies and heads, quantified by RT-qPCR. Data show the mean ± SD normalized to WT body, for at least three independent experiments. Comparisons were performed against WT body and head using an unpaired two-tailed t-test ([*] P < 0.01). (E) Relationship between the extent of 3′UTR-APA difference (relative expression difference, or RED) and aUTR size, as in Figure 3E.

