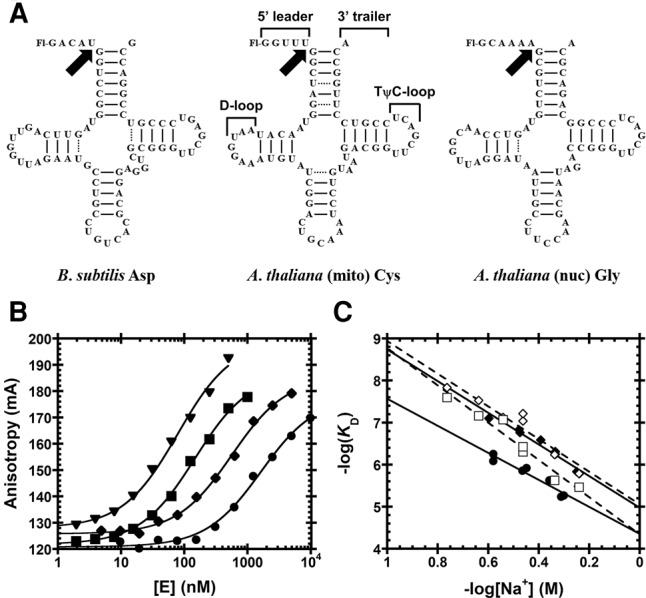
FIGURE 2.

Substrates used for functional assays. (A) Substrates containing a 5′-fluorescein label include pre-tRNAAsp from Bacillus subtilis and Arabidopsis thaliana pre-tRNACys and pre-tRNAGly from the mitochondrial and nuclear genomes, respectively. Structural features of pre-tRNA are detailed on pre-tRNACys, including the 5′ leader, 3′ trailer, and the D- and TψC-loops. Black arrows indicate canonical RNase P cleavage site. (B) Fluorescence anisotropy binding curves for AtPRORP1 binding to B. subtilis pre-tRNAAsp (log scale). A hyperbola (Equation 1, Materials and Methods) was fit to the data. Data were measured in 30 mM MOPS pH 7.8, 1 mM TCEP, and 20 mM CaCl2 with 250 mM (▾), 330 mM (▪), 450 mM (♦), and 550 mM NaCl (•). (C) Na+ dependence of AtPRORP affinity. Equation 4 (Materials and Methods) was fit to the data. The slope of the line (Z) reports on the apparent number of ionic interactions with substrate phosphodiester bonds, while the intercept [log(K0)] reports on the nonionic contributions to affinity. Data include AtPRORP1 binding to pre-tRNAAsp (♦) and pre-tRNACys (•) in 20 mM Ca2+, as well as AtPRORP2 in 6 mM Ca2+ binding to pre-tRNAAsp (⋄) and pre-tRNAGly (□).
