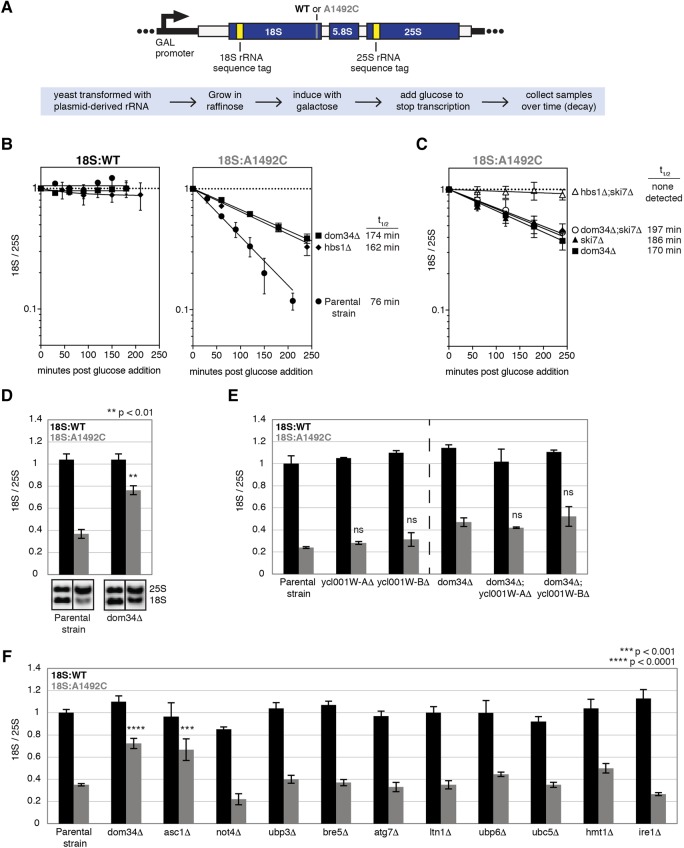
FIGURE 1.
(A) Diagram of rDNA plasmid reporter (top) and summary of experimental design (bottom). The reporter contains sequence tags for Northern blot detection of plasmid-derived 18S and 25S rRNAs. (B) Time course analysis of tagged 18S and 25S rRNAs in parental, dom34Δ, and hbs1Δ yeast strains. (C) Same as B, but for dom34Δ, ski7Δ, dom34Δ;ski7Δ, and hbs1Δ;ski7Δ strains. (B,C) Tagged 18S:tagged 25S ratios (18S/25S) were normalized to the T = 0 time point; error bars represent standard error of the mean (n = 3). 18S:A1492C half-life is indicated on the right. (D–F) Single time-point analyses of tagged 18S rRNAs. Error bars represent standard error of the mean (n = 3). (D) Unpaired t-test was used for significance testing against parental strain 18S:A1492C levels. (E) One-way ANOVA with planned comparisons was used for significance testing comparing 18S/25S in parental strain to single mutants or in dom34Δ strain to double mutants. (ns) Not significant. (F) One-way ANOVA with planned comparisons was used for significance testing comparing 18S/25S in all mutant strains against the parental strain.

