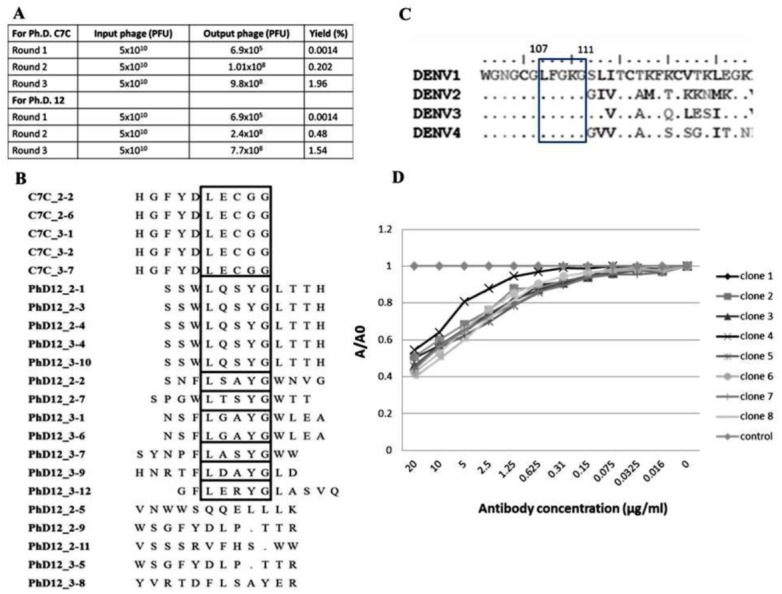
Figure 4. Epitope mapping by phage display of random peptide libraries.

(A) Affinity selection of phage-display. Ph.D.-12 and Ph.D.-C7C Phage Display Peptide Libraries were used in biopanning step. The constant units of phage (5 × 10¹⁰ PFU) was used for three rounds of biopanning. Increasing percent yields of output phages represents the specific enrichment. (B) Alignment of phage-displayed peptide sequences selected by HuMAbs. Phage clones were shown to display a consensus sequences LXXXG (show in the box). (C) Comparison of the amino acid sequences of E proteins DENV1–4. In the box, DENV1–4 shared the same amino acids at positions 107 (L), 108 (F), 109 (G), 110 (K), and 111 (G). (D) Phage inhibition ELISA of eight phage clones which matched to the motif of 107LXXXG111. Phage lysate of selected clones bound with HuMAb in solution phase and the free phage clones were detected by ELISA. The absorbance values were measured at 450 nm using an ELISA reader (TECAN). Absorbance values of each concentration (A) were divided by absorbance values of no antibody (control) (A0), resulting in normalized values (A/A0). Anti-influenza antibody was used as negative control.
