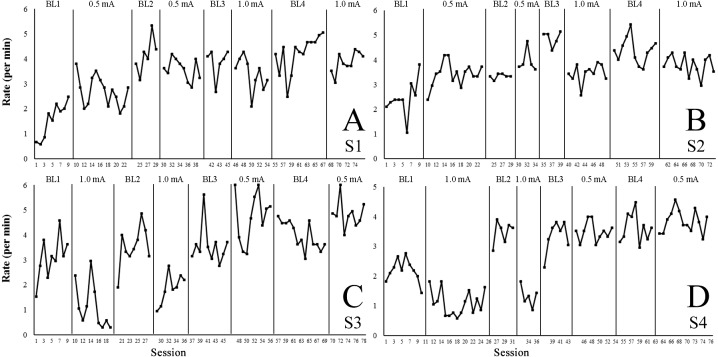
Figure 3. Rate of step-down responses per minute across the baseline and treatment conditions.
(A–D) shows for each subject (S1–S4) the rate of step-down responses (platform descents) per minute across the baseline (BL1–BL4) and treatment conditions (0.5 mA or 1.0 mA). Note: S1 and S2 differed from S3 and S4 regarding the order in which they were exposed to the treatment conditions—i.e., S1 and S2 initiated the experiment with foot shocks of 0.5 mA, whereas S3 and S4 received 1.0 mA shocks first.

