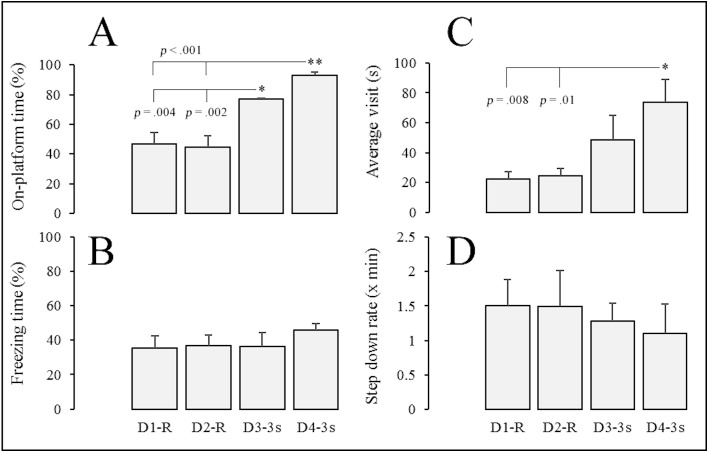
Figure 4. Average percentage of session time spent on the platform and freezing, average duration of visits to the platform in seconds, and rate of step-down responses per minute.
Bars in (A) and (B) represent average percentage of session time that gerbils (n = 5) spent on the platform and freezing, respectively. (C) shows average duration of visits to the platform in seconds, and (D) the rate of step-down responses per minute. Error bars represent 1 S.E.M. Note: D, day of the experiment; R, foot shocks delivered with a random-time schedule 30 s (RT 30s); 3 s, foot shocks delivered every 3 s. ∗, statistically significant post-hoc comparisons.

