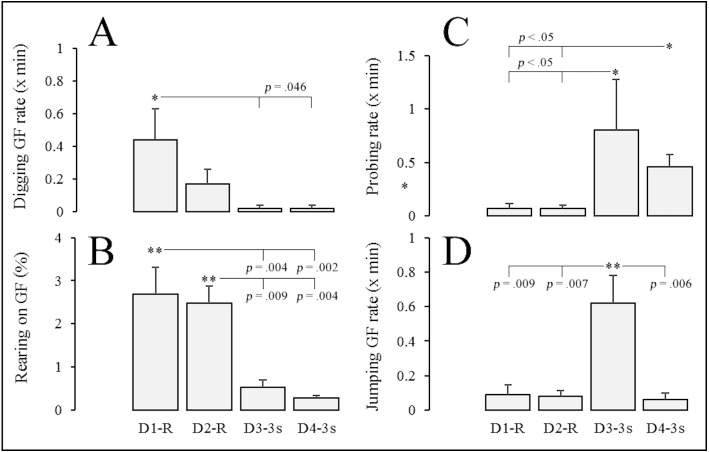
Figure 5. Exploratory behavior of gerbils across the different sessions of Experiment 2.
The exploratory behavior of gerbils (n = 5) across the different sessions of Experiment 2–the digging rate on the grid floor (GF) is shown on (A), percentage of session time rearing on (B), rate of probing from the platform on (C), and jumping rate on (D). Error bars represent 1 S.E.M. Note: D = day of the experiment (session); R = foot shocks delivered on a random-time schedule of 30 s (RT-30s); 3 s, = foot shocks delivered every 3 s. *, statistically significant post-hoc comparisons.

