Fig. 6.

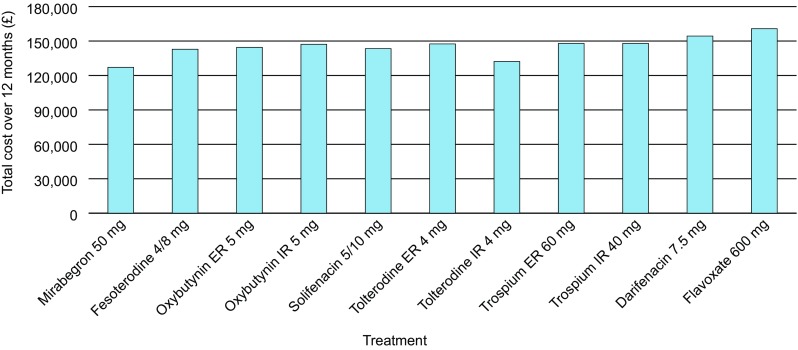
Total costs (including indirect costs) over 12 months for each treatment per 100 patients. All doses reported are the total dose per day. ER extended release, IR immediate release

Total costs (including indirect costs) over 12 months for each treatment per 100 patients. All doses reported are the total dose per day. ER extended release, IR immediate release