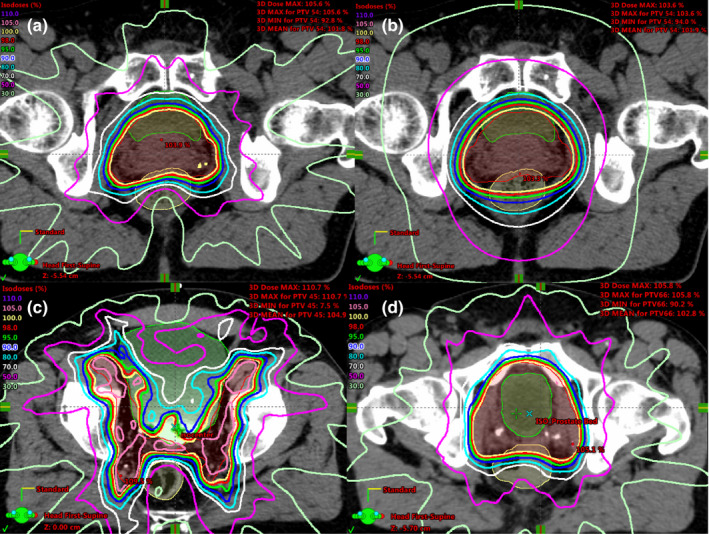
Figure 1.

An example of the anatomy and dose distribution of G1–G4 cases: (a) a prostate case (G1) shown with the clinical IMRT dose distribution; (b) the same prostate case from (a) shown with the DARC dose distribution (G4); (c) a prostate plus LN case with the clinical IMRT dose distribution (G2); (d) a prostate bed case (G3) with the clinical IMRT dose distribution. [Color figure can be viewed at wileyonlinelibrary.com]
