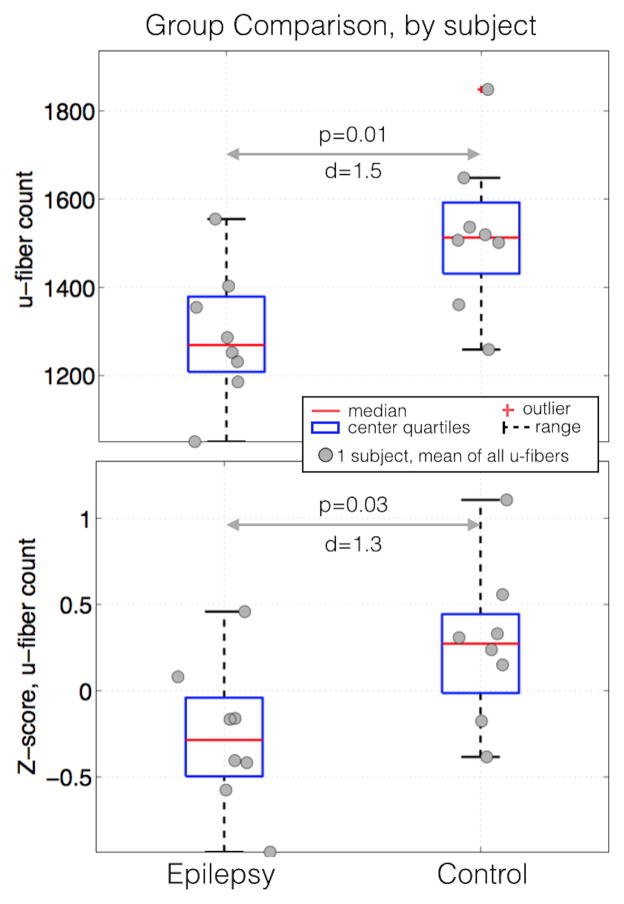
Figure 2.
Box and whisker plots of the z-score of the u-fiber count, the total number of tracks connecting each region. Red horizontal lines indicate the median value of each distribution while the blue boxes delineate the 25th to 75th percentiles. Gaussian random shifts in the × direction are added to each data point to aide visualization.

