
Fig. 3.
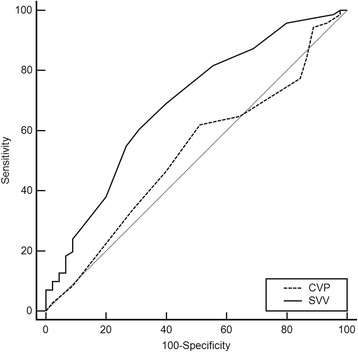
Receiver operating characteristics (ROC) curve analyses to predict change of mean arterial blood pressure after thoracic epidural anesthesia. The AUC of SVV was 0.687 (95% CI, 0.587–0.787) whereas AUC of CVP (0.477 [95% CI, 0.369–0.584]). The performance to predict 20% change of mean arterial pressure was significantly different (P = 0.026). The optimal cutoff value of SVV to discriminate between responders and non-responders was 9.5% (sensitivity: 60.6%, specificity: 68.9%)