
Fig. 1.
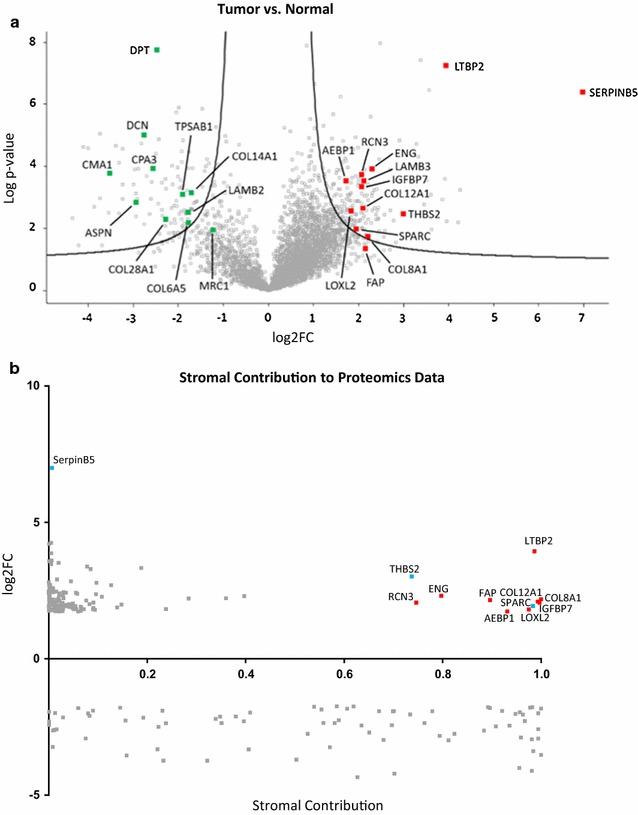
Proteom analysis of CRC. a Protein abundances in tumor versus normal tissue samples. Volcano plot representing differences in LFQ values (log2FC, fold-changes in logarithmic scale to the base of two) of proteins including corresponding p values (logarithmic scale). Red labeled proteins are higher abundant in the tumor tissue whereas green labeled proteins are higher abundant in the normal tissue samples. b Stromal contribution. Proteomics derived data of significantly regulated proteins were plotted against stromal contribution of their respective mRNA [41]. Red indicates upregulated proteins of stromal origin. Blue indicates the 2 stromal proteins THBS2 and SPARC plus the parenchymal SerpinB5 that were chosen for IHC staining