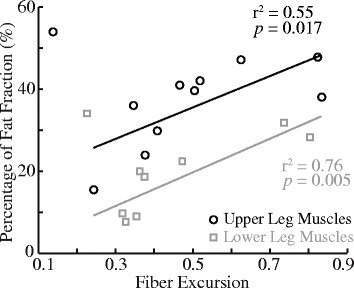
Fig. 7.

Muscle excursion was highly correlated with fat fraction for both upper leg and lower leg muscles, respectively, in patients with DMD. Fiber excursion was from Fig. 4 (red bars), and fat fraction, a metric of the extent of muscle degeneration, was measured from patients with DMD in a previous magnetic resonance imaging study (see Fig. 2 in [53]). Each circle and square represents one upper leg and lower leg muscle
