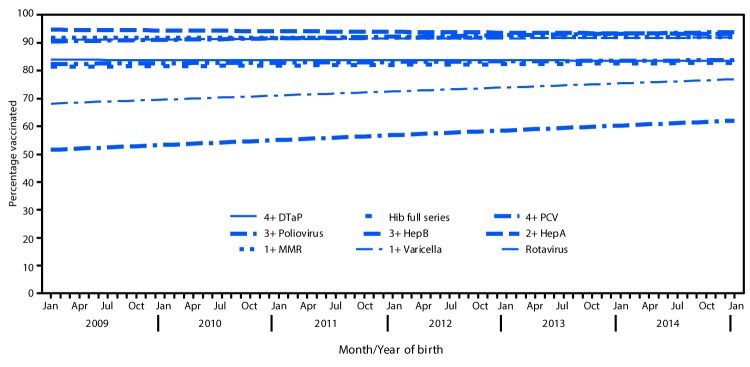
FIGURE.
Estimated linear trend in coverage with selected vaccines* by age 24 months,† by month and year of birth§ — National Immunization Survey-Child, United States, 2012–2016
Abbreviations: DTaP = diphtheria and tetanus toxoids and acellular pertussis vaccine; HepA = hepatitis A vaccine; HepB = hepatitis B vaccine; Hib = Haemophilus influenzae type b vaccine; MMR = measles, mumps, and rubella vaccine; PCV = pneumococcal conjugate vaccine.
* Hib full series: receipt of ≥3 or ≥4 doses, depending on product type received (primary series and booster dose). Rotavirus includes ≥2 or ≥3 doses, depending on product type of vaccine received (≥2 doses for Rotarix [RV1], or ≥3 doses for RotaTeq [RV5]).
† Except for rotavirus, vaccination coverage was assessed before the child reached age 24 months. The Kaplan-Meier method was used to account for censoring of vaccination status for children assessed before age 24 months. Rotavirus vaccination was assessed before the child reached age 19 months and might include some vaccinations reported as received after the maximum recommended age of 8 months, zero days.
§ Estimated linear relationship between month and year of birth and vaccination coverage, based on weighted linear regression analysis using the inverse of the estimated variance of each point estimate to construct the weights. Estimated percentage point change over 12 consecutive birth months: 4+ DTaP -0.05 (-0.4, 0.3); 3+ Poliovirus -0.3 (-0.5, -0.006); 1+ MMR 0.05 (-0.2, 0.3); Hib full series 0.2 (-0.1, 0.6); 3+ HepB 0.6 (0.3, 0.9); 1+ Varicella 0.1 (-0.1, 0.4); 4+ PCV 0.2 (-0.1, 0.6); 2+ HepA 1.7 (1.2, 2.3); Rotavirus 1.4 (1.0, 1.9).

