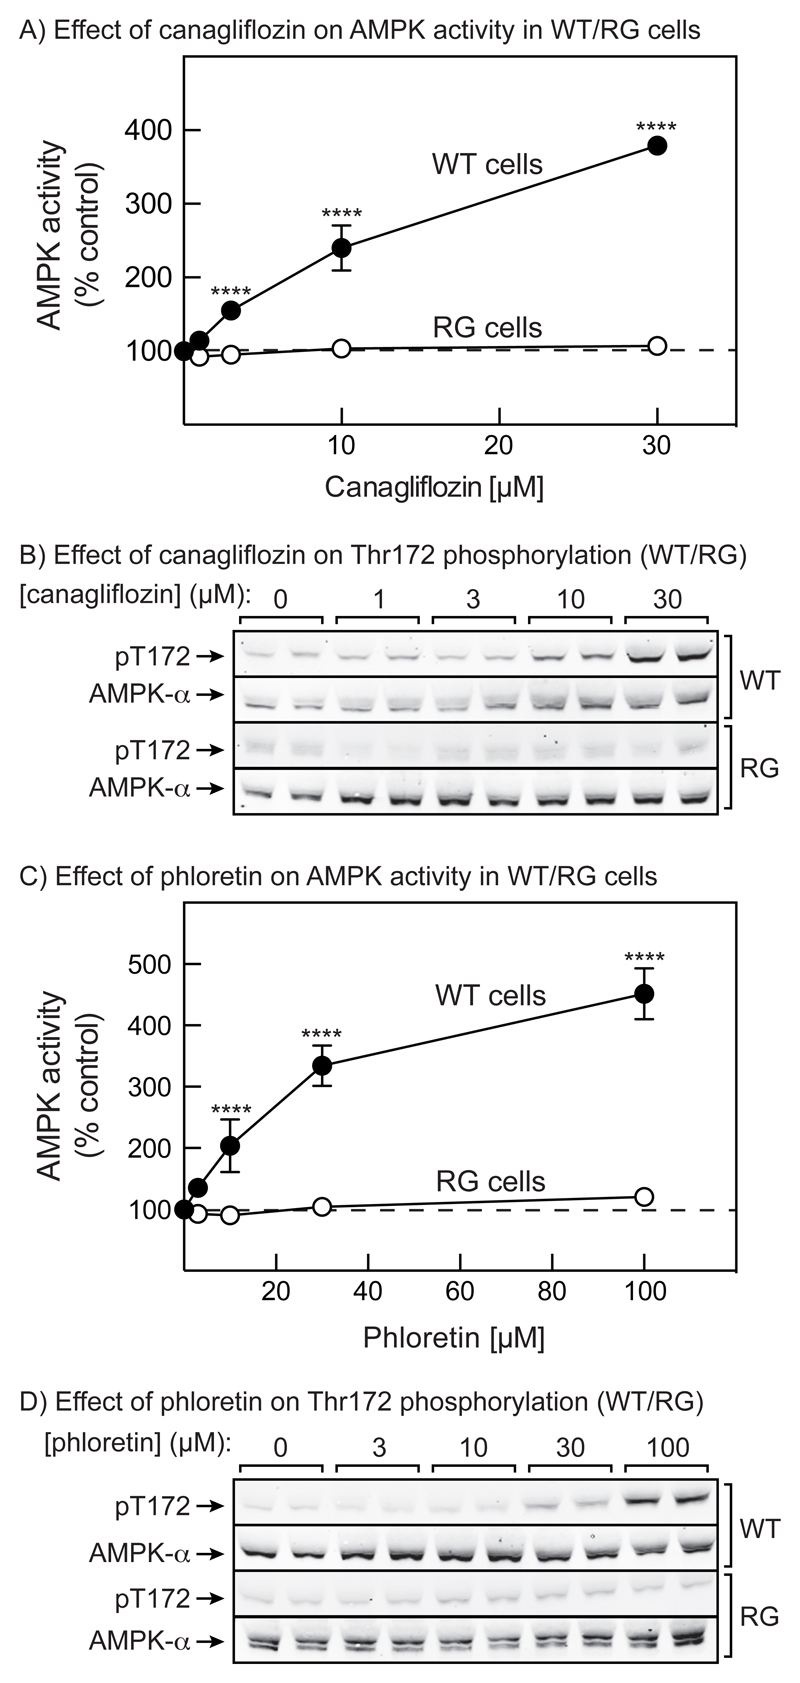
Figure 3. Comparison of AMPK activation by canagliflozin and phloretin in WT and RG cells.
(A) WT and RG HEK-293 cells were treated for 1 hr with the indicated concentrations of canagliflozin, and the results of kinase assays in anti-αimmunoprecipitates are shown (mean ± SEM, n = 4 to 6). Significance of differences from vehicle control are indicated. (B) Analysis of AMPK phosphorylation in duplicate dishes of cells from the same experiment as in (A). (C) As (A), but using phloretin. (D) As (B), but using phloretin. See Fig. S2 in Supplementary data for quantification of these blots.

