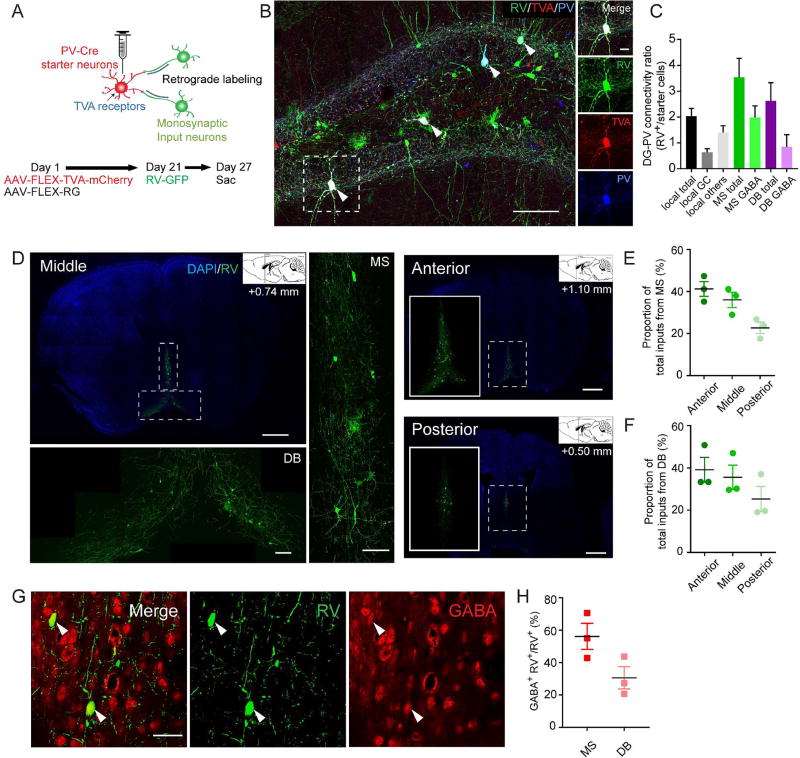
Figure 1. Dentate PV interneurons receive monosynaptic GABAergic inputs from the medial septum and diagonal band of Broca.
(A) Experimental scheme of monosynaptic retrograde rabies tracing in the DG of PV-cre animals. (B) Confocal images showing the starter PV neurons in DG (arrowheads). Scale bar: 100 µm (left), 20 µm (right). (C) Connectivity ratio of DG-PV interneurons to different brain regions (n=3). GC, granule cell; MS, medial septum; DB, diagonal band of Broca. (D) Confocal images showing RV input neurons in regions of the MS and DB (n=3). Scale bar: 1 mm (coronal), 100 µm (zoomed-in). (E) Distribution of RV input neurons in the MS (n=3). (F) Distribution of RV input neurons in the DB (n=3). (G) Confocal images showing input neurons in the MS colocalized with GABA marker. Arrow heads pointing to GABA+ RV+ cells. Scale bar: 50 µm. (H) Percentage of GABA+ RV+ out of total input cells in the MS and DB (n=3). Values represent mean ± S.E.M. See also Figure S1.

