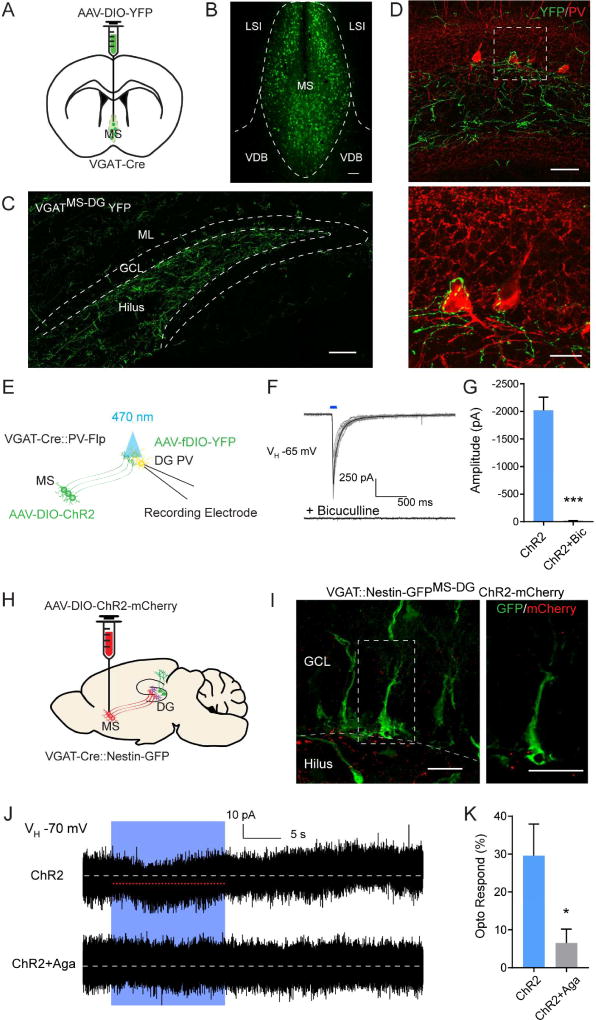
Figure 2. VGATMS-DG projections functionally interact with quiescent NSCs through dentate PV interneurons.
(A) AAV-DIO-YFP injection scheme to the MS of VGAT-Cre mice. (B) Confocal image showing selective targeting of the MS GABAergic neurons in VGAT-Cre mice. MS, medial septum; LSI, lateral septum intermediate; VDB, ventral diagonal band. (C) Confocal image of prominent MS VGAT projections to the SGZ and hilus. GCL, granule cell layer; ML, molecular layer. Scale bar: 100µm. (D) Axonal collaterals from MS GABA cells closely associate with the soma of dentate PV interneurons. Scale bar: 50 µm (top), 20 µm (bottom). (E) Schematic illustration for patch-clamp recording of dentate PV cells in response to light stimulation of VGATMS-DG projections in acute brain slices from VGAT-Cre::PV-Flp double transgenic mice. (F) Overlaid traces showing whole-cell recordings of a dentate PV cell responding to blue light of VGATMS-DG projections expressing ChR2. Black line indicates a single example trace. Reponses were blocked by bicuculline. (G) Average amplitude of light evoked postsynaptic currents from dentate PV cells in the absence and presence of bicuculline (n=3 cells with total 25 trials for ChR2, and 10 trials for ChR2+Bicuculline). (H) AAV-DIO-ChR2-mCherry injection scheme to the MS of VGAT-Cre::Nestin-GFP double transgenic mice. (I) No association between VGATMS-DG projections and GFP+ rNSCs. Scale bar: 50 um (left), 20 um (right). (J) Whole-cell voltage-clamp recording of GFP+ rNSC upon light stimulation of ChR2-expressing VGATMS-DG projections (top trace). Identical recording as above, but in the presence of ω-Agatoxin TK to block P/Q type Ca2+ channels specific to PV interneurons (bottom trace). White dotted line is mean baseline level, red line highlights the small inward deflection during the light stimulation. (K) Probability of detecting light-evoked responses for the two recording conditions depicted in Figure 2J. Trials with mean deflection >4 pA are considered responding to light stimulation (n=5). *p<0.05, ***p<0.001 by Student’s t-test. Values represent mean ± S.E.M. See also Figure S2.

