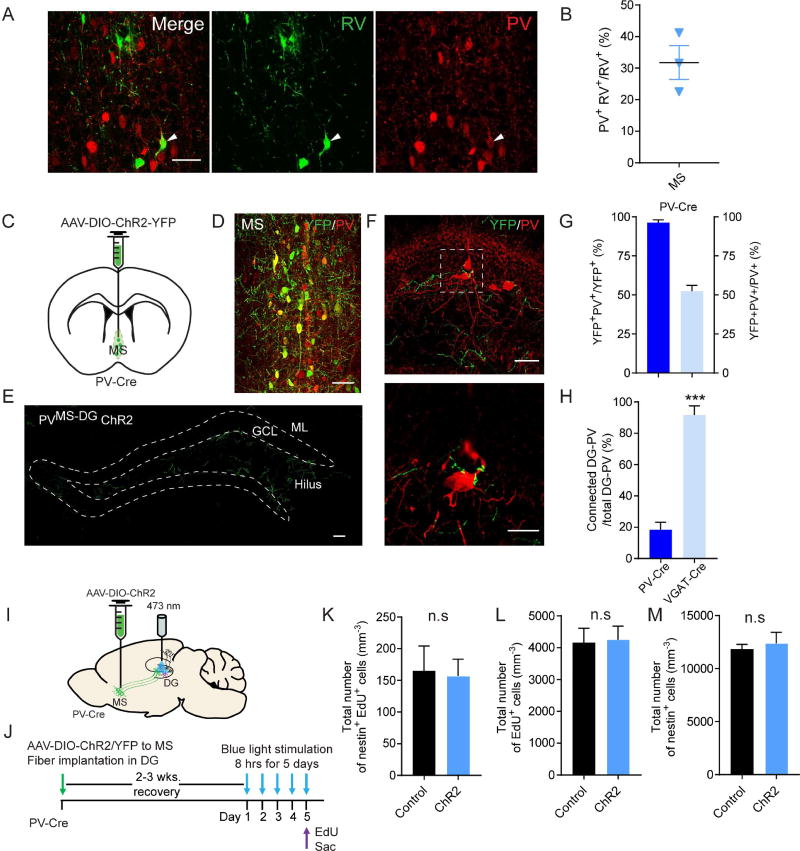
Figure 5. MS PV projection neurons alone are not sufficient to regulate NSC quiescence.
(A) Confocal images showing RV input neurons in the MS colocalize with PV marker. Arrow heads pointing to PV+ RV+ cells. Scale bar: 50 µm. (B) Percentage of PV+ RV+ out of total RV input cells in the MS (n=3). (C) AAV-DIO-YFP injection scheme to the MS of the PV-Cre mice. (D) Confocal image showing selective targeting of the MS PV neurons through stereotaxic delivery of AAV-DIO-YFP to the PV-Cre mice. Scale bar: 50 µm. (E) Confocal image of sparse AAV-DIO-YFP labeled MS PV projections to the SGZ and hilus. Scale bar: 50 µm. (F) Axonal collaterals from MS PV cells are closely associated with the soma of dentate PV interneurons. Scale bar: 50 µm (top), 20 µm (bottom). (G) YFP viral labeled MS PV neurons in PV-Cre mice (n=6). (H) Connected percentage of MS projections to DG-PV neurons (n=6 for PV-Cre, and n=4 for VGAT-Cre). (I) AAV-DIO-ChR2-YFP injection scheme to the MS in the VGAT-Cre mice. (J) Experimental paradigm for in vivo optogenetic stimulation. (K–M) Density of activated rNSC (nestin+EdU+), proliferating cells (EdU+), and the rNSC pool (nestin+). (n=5 for control, and n=6 for ChR2). ***p<0.001 by Student’s t-test. Values represent mean ± S.E.M. See also Figure S5.

