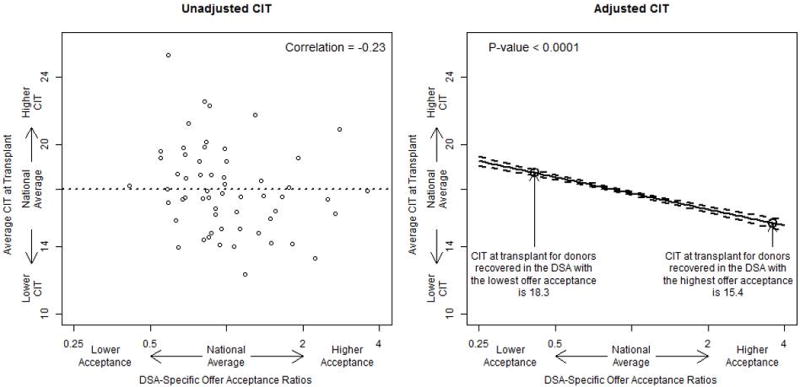
Figure 2.

The association between DSA-specific offer acceptance ratios and the average CIT at transplant in hours. The “national average” is the average CIT at transplant for donors recovered in each DSA. The adjusted analysis presents the expected CIT at transplant for a median donor across the spectrum of DSA-specific offer acceptance ratios. CIT, cold ischemia time; DSA, donation service area.
