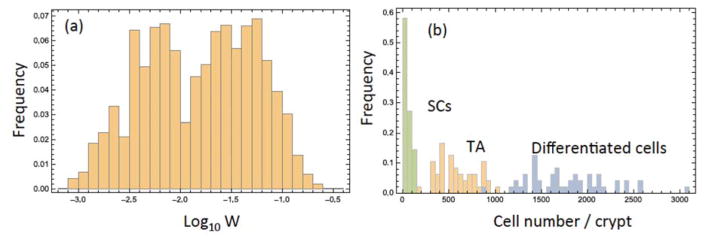
Figure 1.
Estimating cell numbers. (a) Histogram of the experimentally calculated values of W, equation (1). The apparent bimodality of the distribution may be ascribed to the relative scarcity of the data, because the distribution on a non-logarithmic scale does not appear bimodal. (b) Histograms showing the distribution of cell numbers per crypt, by cell type, where W = 0.03 was assumed.

