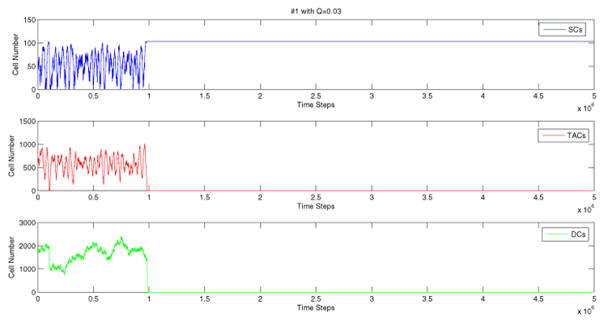
Figure 10.
A simulation of network #1 when q = 0.1 and W = 0.03. The left figure is for linear function of L1 described by equation (17), and the right figure is for the nonlinear control of L1 (see appendix A), whereas we hold other control functions as linear in both cases.

