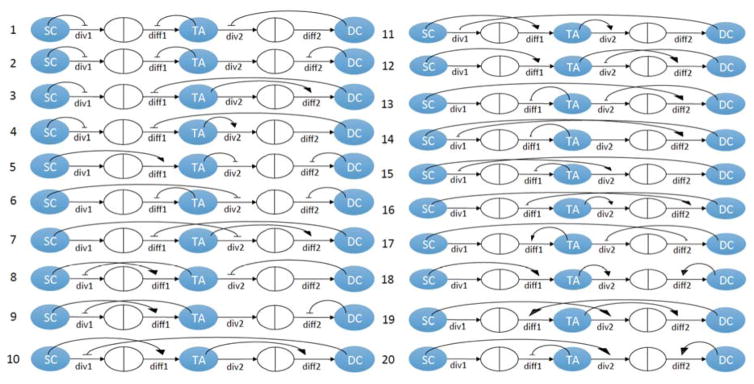
Figure 2.
Twenty 3-compartment minimal control networks identified in Komarova (2013), which are characterized with constant death rates. The three types of cells are marked by SC (stem cells), TA (transient amplifying cells), DC (differentiated cells). Horizontal arrows indicate the cell fate decisions: div1 and div2 the division process of SCs and TACs; diff1 and diff2 are the probability of the division to be a differentiation, as opposed to proliferation, for SCs and TACs respectively. The curved positive and negative arrows indicate control. The point of the arrow corresponds to the process that is being controlled, and the base of the arrow corresponds to the cell type controlling the process.

