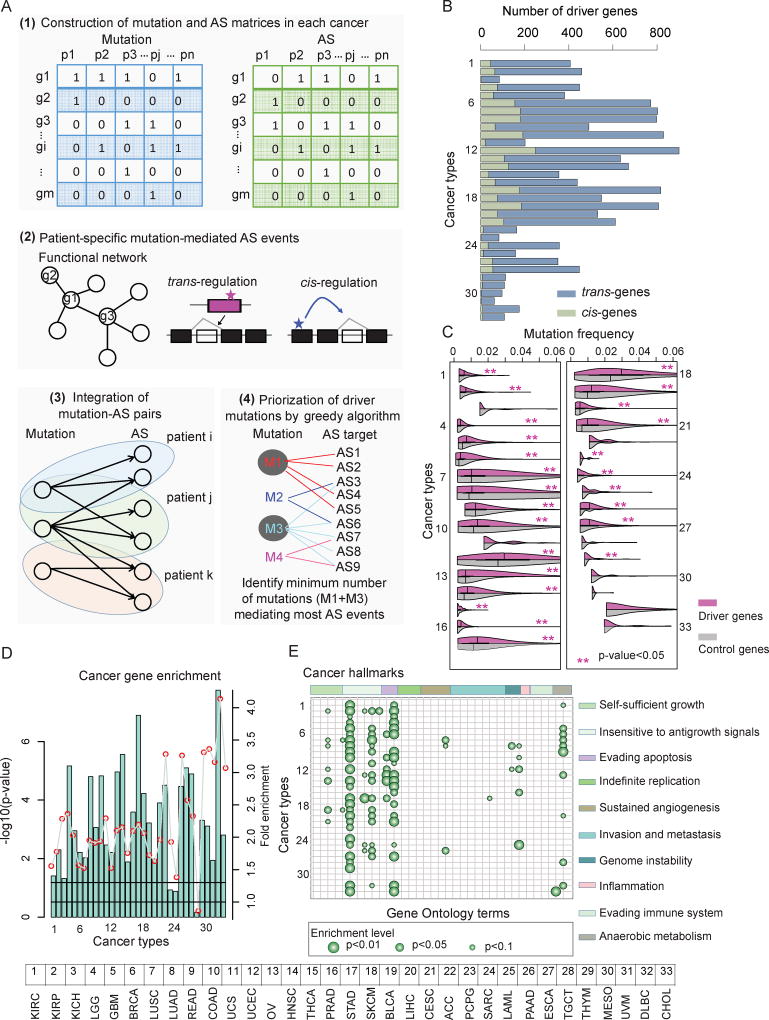
Figure 3. Identification of Drivers based on Alternative Splicing Perturbations across Cancer Types.
(A) The network-based framework to identify driver mutations and their mediated AS targets. Firstly, mutation (blue) and differential AS (green) matrices are constructed. Next, patient-specific mutation-mediated AS events are identified based functional network structure. All mutation-AS pairs are assembled as a bi-graph and a greedy search method is used to identify driver mutations and AS events.
(B) Number of driver genes identified in each cancer. The light blue bars indicate the number of trans-genes while the light green bars indicate the cis-genes.
(C) Mutation frequency of driver genes and randomly selected genes. P-values (Wilcoxon rank-sum test) less than 0.05 were marked with red stars. Purple boxes indicate the distribution for candidate driver genes, while gray boxes indicate the distribution of background control (random genes).
(D) P-values (log10 transformation, hypergeometric test) for driver gene enrichment analysis for Cancer Census Genes across cancer types.
(E) Enrichment analysis of driver genes for cancer hallmarks. Each column indicates a cancer hallmark-related Gene Ontology (GO) term while each row indicates a type of cancer.
GO terms are ranked based on the hallmarks they belong to. Bigger dots indicate small p-values (hypergeometric test). The ten hallmarks from left to right: self-sufficiency in growth signals; insensitivity to antigrowth signals; evading apoptosis; limitless replicative potential; sustained angiogenesis; tissue invasion and metastasis; genome instability and mutation; tumor-promoting inflammation; evading immune detection; and reprogramming energy metabolism.
The numbering of cancer types (B through E) is the same as in Figure 1.

