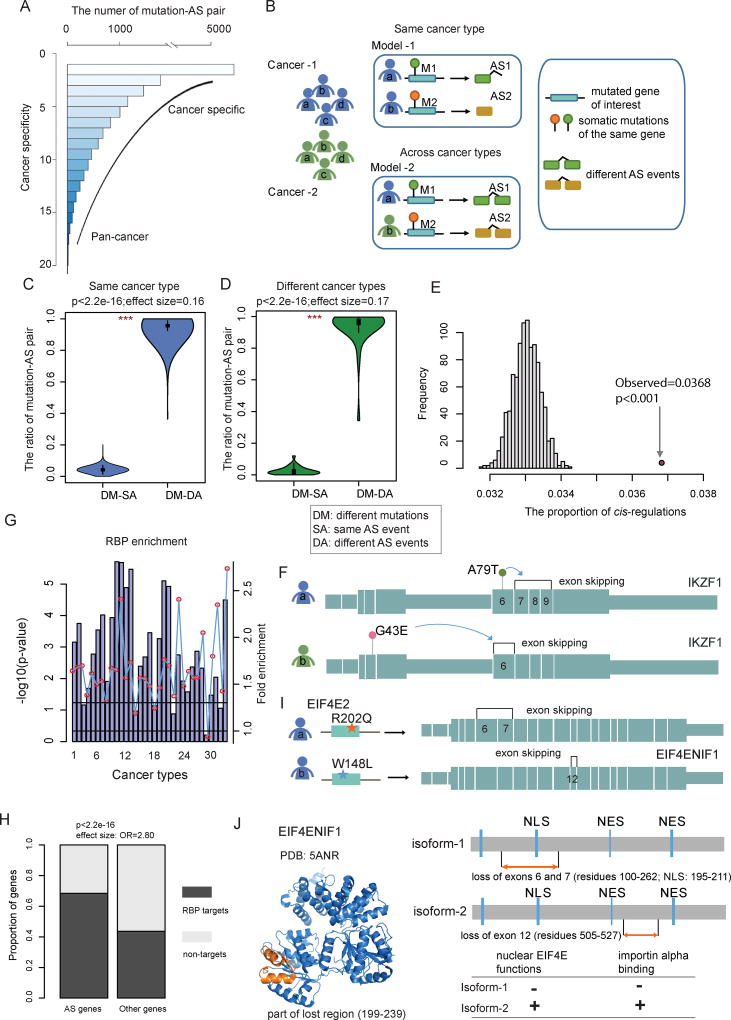
Figure 4. Somatic Mutation-Mediated Alternative Splicing Helps Explain Genetic Heterogeneity.
(A) Frequency of mutated gene-AS gene pairs across cancer types. The lower the cancer specificity index, the more cancer type-specific. Higher specificity index indicates a more spread-out pan-cancer manner. The majority of pairs are cancer specific while a small subset is found in multiple cancer types.
(B) The proposed models to explain genetic heterogeneity in the same cancer type or across cancer types. Model-1: different mutations in the same gene affect distinct alternative splicing events in cancer patients of the same cancer type. Model-2: different mutations in the same gene affect distinct alternative splicing events in cancer patients across different cancer types. (C and D) Fraction of different types of mutation-AS pairs. DM, different mutations; SA, same AS event; DA, different AS events. Violin plots show the proportion of DM-SA and DM-DA in the same cancer type (C) or across distinct cancer types (D). Statistical differences are calculated by Wilcoxon rank-sum test (***, p<1.0e-32).
(E) The number of cis-AS events compared to 1,000 random selections of protein pairs of the same number to evaluate statistical significance.
(F) cis-AS example showing mutations in IKZF1 mediating its own AS. The panel shows the exon structure and two representative AS events influenced by two mutations in the same gene.
(G) P-values (log10 transformation, hypergeometric test) for driver gene enrichment analysis for RNA-binding proteins across cancer types. The numbering of cancer types is the same as in Figure 1.
(H) Proportion of RBP binding target genes identified by CLIP-seq experiments, for the differential AS gene group versus the group of other genes.
(I) trans-AS example showing mutations in the RBP gene EIF4E2 influencing the AS events of EIF4ENIF1 in breast invasive carcinoma (BRCA). The panel shows the exon structure of the target gene EIF4ENIF1 and two representative AS events in EIF4ENIF1 influenced by two EIF4E2 mutations.
(J) Structural and functional features of the EIF4ENIF1 alternative splicing. The structure of EIF4ENIF1 is from the PDB database. The lost regions are marked with orange color. The possible functional consequences are shown on the right panel.
See also Figure S4.

