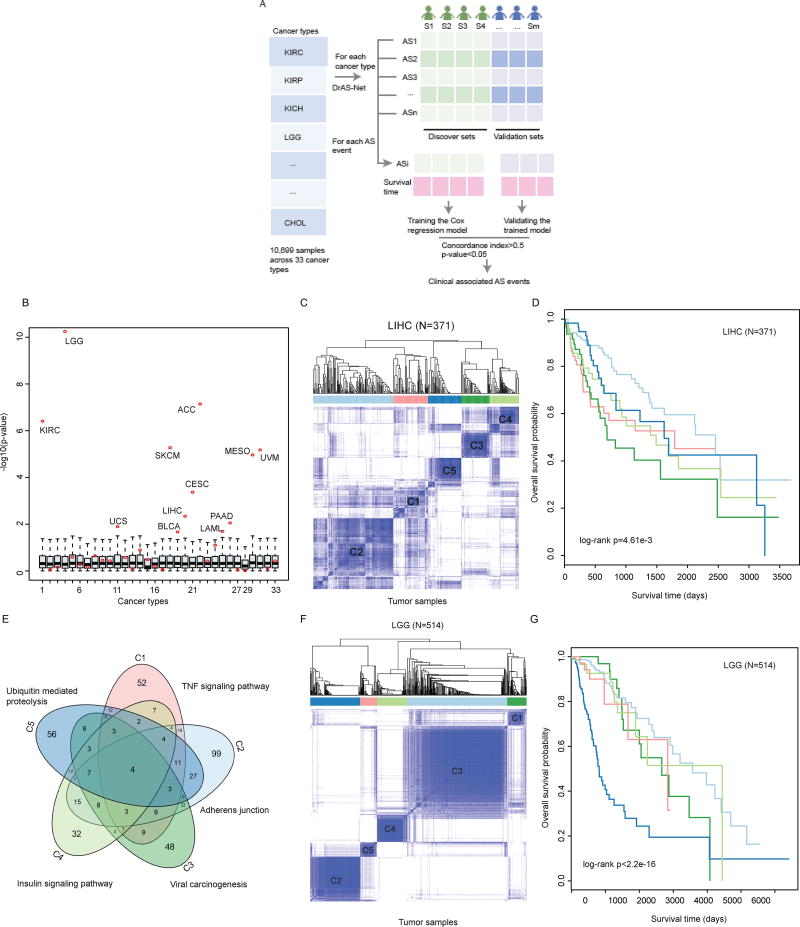
Figure 5. Alternative Splicing Perturbation Reveals Cancer Subtypes with Distinct Clinical Features.
(A) The workflow to discover the clinical associated AS events. The tumor samples in each cancer type were divided into discovery set and validation set. Cox regression model was trained using the discovery set and validated in the remaining samples. AS events with concordance index greater than 0.5 and p-value less than 0.05 were identified as clinical associated.
(B) The survival differences of different cancer subtypes revealed by alternative splicing clustering analysis. The cancer samples are randomly divided into the same number of subtypes as revealed by AS clustering, and the survival difference p-values are calculated by log-rank test. −log10(p) values are plotted as boxplots. The log-rank p values obtained in real conditions are marked with red dots. The numbering of cancer types is the same as in Figure 1.
(C) Consensus clustering of LIHC patients (n=371) based on the mutation-mediated AS events. The color intensity indicates the consistency (ranging from 0 to 1, from light to dark blue) for each pair of samples that are clustered together in 100 times of sampling.
(D) Kaplan-Meier plot of survival for five subtypes in LIHC. The survival difference among five clusters is calculated by log-rank test (p=4.61e-3).
(E) Overlap of mutated genes that mediate AS events in five subtypes. The top enriched functional terms by the mutated genes are marked.
(F) Consensus clustering of LGG patients (n=514) based on the mutation-mediated AS events. The color intensity indicates the consistency (ranging from 0 to 1, from light to dark blue) for each pair of samples that are clustered together in 100 times of sampling.
(G) Kaplan-Meier plot of survival for five subtypes in LIHC. The survival difference among five clusters is calculated by two-sided log-rank test (p<2.2e-16).

