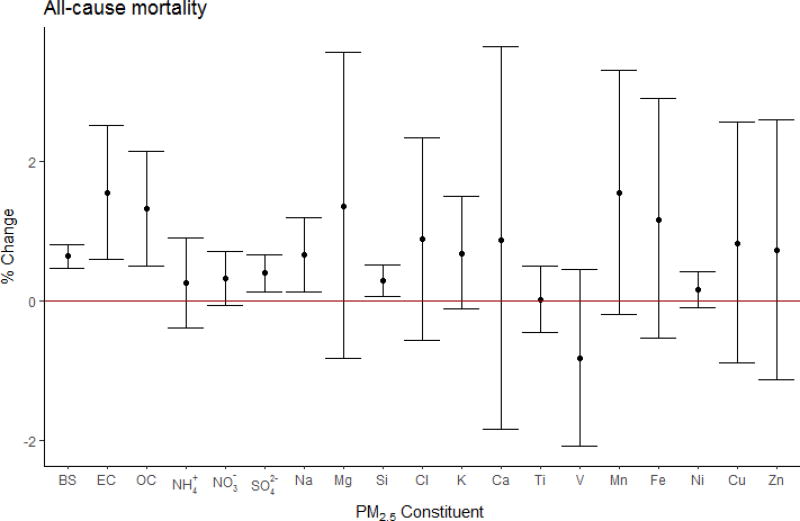
Figure 2.
All-cause mortality pooled effect estimates using city-specific estimates, expressed in percent change in mortality per IQR* increase in PM2.5 constituent with 95 % confidence intervals. (*BS:10, EC:2.6, OC:6.1, NH4+:4.7, NO3−:5.0, SO42−:5.1, Na:0.48, Mg:0.17, Si:0.21, Cl: 1.1, K:0.53, Ca:0.17, Ti:0.017, V:0.007, Mn:0.009, Fe:0.15, Ni:0.005, Cu:0.014, Zn:0.054) µg/m3).

