
Figure 6.
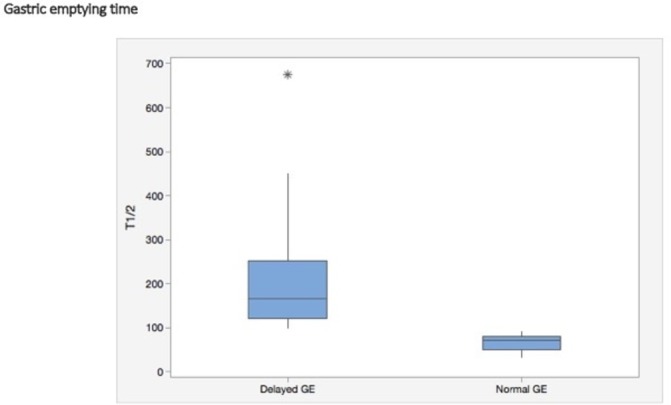
Box plot depicting the magnitude (T½ in minutes) of GE delay in the patients with delayed GE (gastroparesis, n=44) versus those with normal GE (n=17), representing minimum and maximum values (vertical lines), first and third quartiles (boxes) and median value (horizontal lines). Asterisk represents the outlier value. GE, gastric emptying.