
Figure 7.
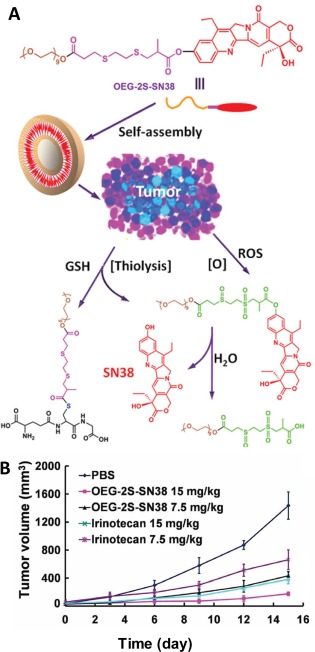
(A) Chemical structure of the prodrug and schematic illustration of self‐assembly and drug release via both thiolysis and ROS oxidation. (B) Plot of tumor volume of mice treated with OEG‐2S‐SN38 and irinotecan at different dosages versus time. Adapted from Ref. 65 with permission. Copyright 2013 Wiley‐VCH Verlag GmbH & Co. KGaA, Weinheim