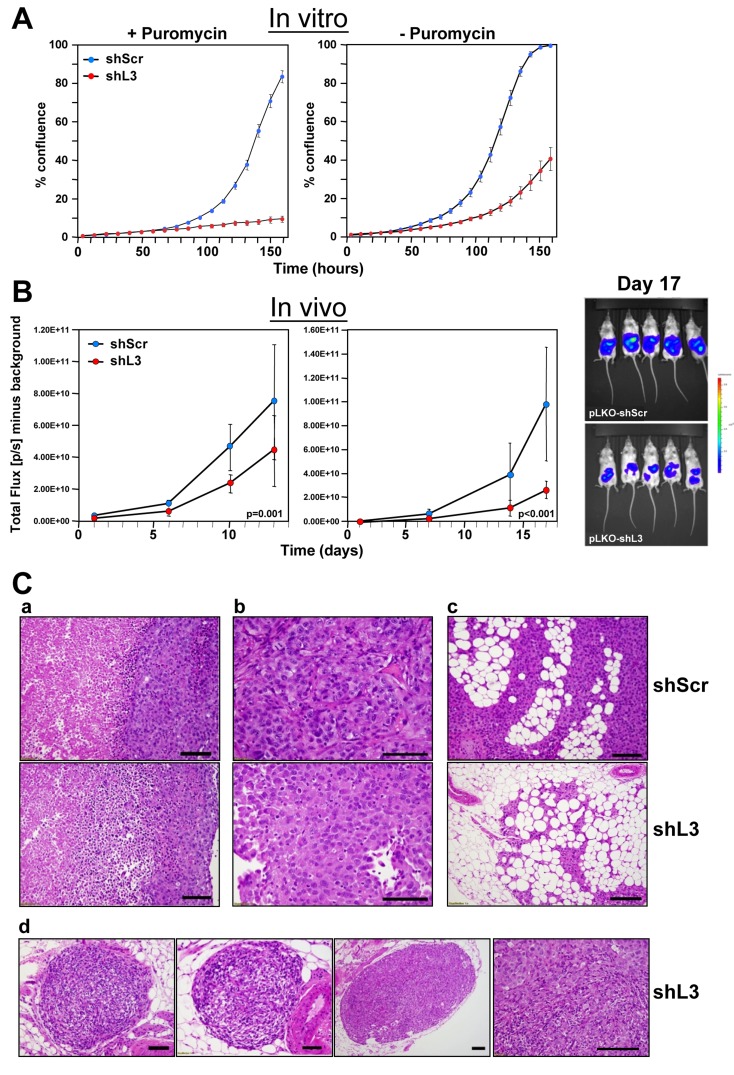
Figure 1. Expression of a CD95L derived shRNA causes induction of DISE in vitro and in vivo.
A. Percent growth change over time of HeyA8 Venus-siL3-pFUL2T cells infected with either shScr or shL3 pLKO lentiviruses (MOI = 5) (with and without puromycin selection) at 250 cells/well. B. Small animal imaging of HeyA8 pFUL2T cells infected with either shScr or shL3 pLKO lentiviruses (MOI = 5) after i.p. injection into NSG mice (10 mice per group, 106 cells/mouse). Left: mice injected with cells infected with virus without puromycin selection; Center: Mice injected with HeyA8 cells infected with shRNAs and selected with puromycin for 24 hours. Right: Bioluminescence image of 5 mice 17 days after i.p. injection with HeyA8 cells infected with either shScr or shL3 virus. Two-way ANOVA was performed for pairwise comparisons of total flux over time between shScr and shL3 expressing cells. C. H&E staining of representative tumors isolated from mice carrying HeyA8-shScr (a,b,c, top row) and HeyA8-shL3 tumors (a,b,c, bottom row and d). a, in shScr treated tumors, tumor mass showed two zones of viable (right) and necrotic (left) tumor regions with sharply demarcated boundary. The viable tumor cells were cohesive with dense basophilic and pale cytoplasm. In shL3 treated tumor, a zone of dying tumor cells were seen in between viable and necrotic zones. This zone had tumor cells that were loosely cohesive with mixed dying, dead and viable cells. b, Close view of tumor cells revealed the different cytologic features. In shScr treated tumors, cells were more cohesive with a solid growth pattern with centrally located large and high grade nuclei. In shL3 treated tumors, cells were loosely cohesive with eccentrically located nuclei and eosinophilic and hyaline cytoplasm. These findings suggest early degenerative or regressing changes. c, Tumor infiltrating into fat had minimal or no tumor cell necrosis. In shScr treated tumors, tumor mass in fat had large and high tumor volume (top panel). In shL3, infiltrating tumor cells were much smaller in size and volume and areas of regression change were seen (bottom panel). d, Tumor regression could be frequently seen in shL3 treated tumors, characterized by well demarked tumor nodules (left three images) with peripheral rim of viable tumor cells (right panel) and central regression of tumor bed which was replaced by histiocytes, lymphocytes and fibrotic stromal cells.

