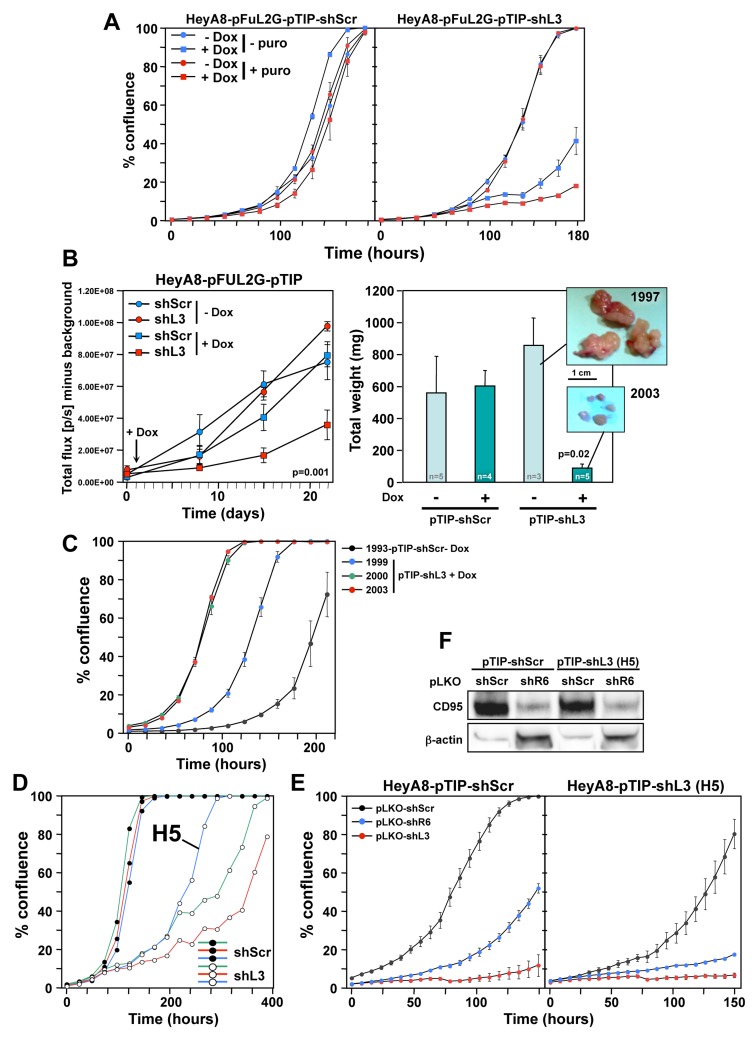
Figure 2. HeyA8 cells regress in vivo after inducible expression of shL3 and become resistant to the inducible vector but not to DISE induction.
A. Percent growth change over time of HeyA8-pFUL2G cells (plated at 250 cells per 96 well) expressing either pTIP-shScr or pTIP-shL3 cultured with or without Dox. B. Small animal imaging of HeyA8-pFUL2G cells expressing either pTIP-shScr or pTIP-shL3 after i.p. injection into NSG mice (106 cells/mouse). Left: Tumor growth over time. The day the mice were given Dox containing drinking water is labeled with an arrow. ANOVA was performed for pairwise comparisons of total flux over time between shScr and shL3 expressing cells. Right: Tumor weight in each treatment group 22 days after tumor cell injection (pictures of the tumors of two representative mice are shown). P-value was calculated using Student’s t-test. C. Change in confluence over time of four tumors isolated from 4 mice in B treated as indicated all in the presence of Dox. D. Change in confluency of HeyA8 cells expressing either pTIP-shScr or pTIP-shL3 in the presence of Dox. Confluency of three wells each is shown. The Dox resistant clone H5 was chosen for further analysis. E. Change in confluency of HeyA8-pFUL2G cells or the H5 clone over time in the presence of Dox after infection with either pLKO-shScr, pLKO-shL3 or pLKO-shR6 (MOI = 6). F. Western blot analysis for CD95 of the cells in E infected with either pLKO-shScr or pLKO-shL3.

