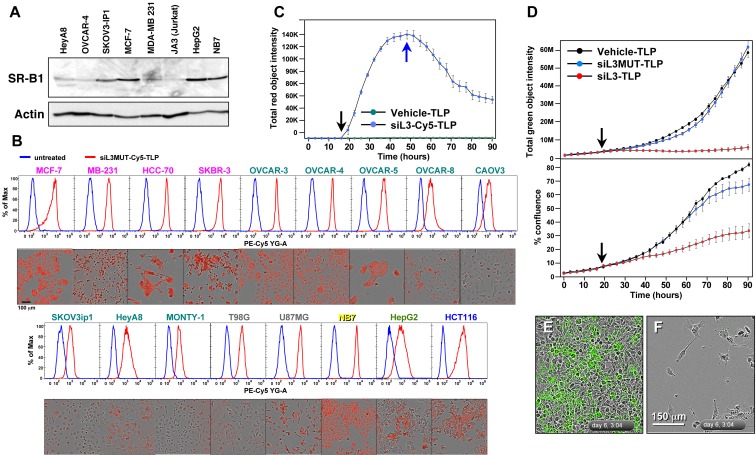
Figure 4. siL3-TLP uptake and DISE induction.
A. Western blot analysis for SR-B1 in different cancer cell lines. B. Uptake of siL3MUT-Cy5-TLP by 17 different cancer cell lines representing 6 different cancers, detected by flow cytometry (top) and phase contrast/red fluorescence (bottom). C. Change of red (Cy5) fluorescence (red object count) over time of HeyA8 cells treated with TLPs. Black arrow, particles were added; Blue arrow, cells were washed and particles removed. D. HeyA8 cells expressing the Venus-siL3 sensor were incubated for 90 hours with 8 nM (RNA concentration) siL3-TLP, siL3MUT-TLP, or Vehicle-TLPs. Cells were analyzed in an IncuCyte Zoom. Top: Total (Venus) green fluorescence. Bottom: Confluency. E., F. Images (merged phase contrast and green fluorescence) of the cells after a 147 hours incubation with either Vehicle-TLP (E) or siL3-TLP (F).

