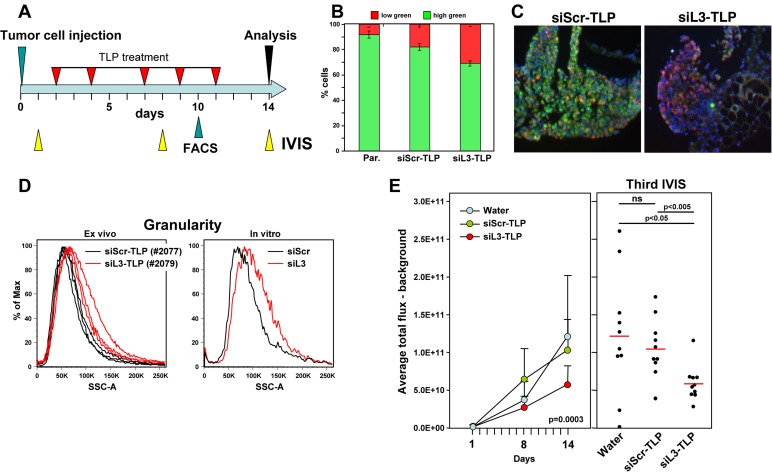
Figure 5. Induction of DISE in vivo.
A. Treatment scheme. B. Red/green ratio of tumor cells isolated from three mice each treated with either siScr-TLP and siL3-TLP compared to parental HeyA8-Venus-siL3-pFUL2T cells. C. Immunofluorescence images of representative tumors from mice treated with either siScr-TLP or siL3-TLP. Size bar = 300 µm. D. Left: Change in sideward scatter (granularity) of cells isolated from three tumors from two mice treated with either siScr-TLP or siL3-TLP. Right: Change in granularity in HeyA8 cells in which DISE was induced by transfection of siL3 (2’O-methylated, Dharmacon) compared to matching siScr. E. Small animal imaging of 5 x 10⁵ HeyA8-pFUL2T cells injected i.p. into NGS mice treated with either water, siScr-TLPs or siL3-TLPs. Left: Tumor growth over time. ANOVA was performed for pairwise comparisons of average flux over time between siScr and siL3 treated cells. Right: Bioluminescence signal in individual mice at the third IVIS (14 days after tumor injection) treated as indicated following the treatment protocol outlined in A. P-values were calculated using Student’s t test.

