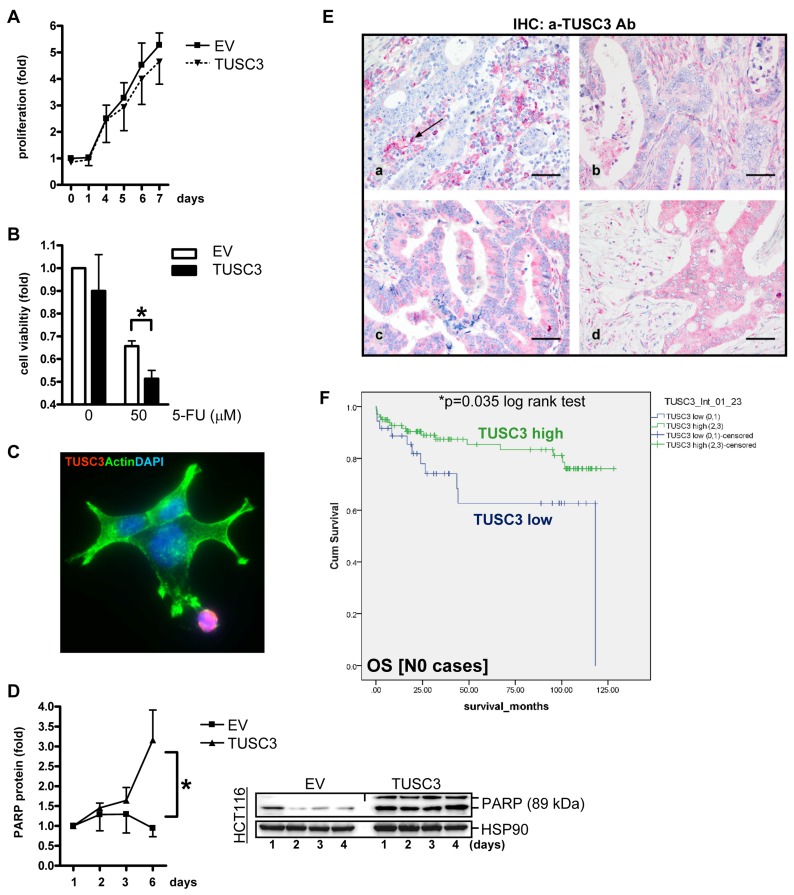
Figure 5. TUSC3 enhances CRC cell death and is associated with prognosis of CRC patients.
A., Growth kinetics. SW480 cells were transfected with TUSC3 or EV plasmid, and proliferation was measured by colorimetric MTT assay after 1 to 7 days. O.D. values were calculated as -fold ± S.E. compared with day 0 (n.s., Two-way ANOVA, n = 3). B., Chemoresistance response. SW480 were transfected for 24 h as in A, followed by an incubation with 5-FU (at 50 µM), and cell viability was determined after 48 h. Data were calculated as in A compared with vehicle control (*p < 0.05 EV vs. TUSC3, Two-way ANOVA, n = 3). C.-D., TUSC3 promotes cell death (apoptosis). SW480 cells were transfected with TUSC3 or EV and incubated for 1 to 6 days. Color code: red = FLAG-TUSC3; green = actin (phalloidin); blue = nuclei (DAPI); magnification x630. Note the spread-out morphology of live TUSC3-negative cells in green vs. round dying TUSC3-positive cells in red. Representative immunofluorescence images (C) and quantitative Western blot analyses (D) from TCL (all 3 cell lines) are shown which detect cleaved PARP (apoptosis marker). Data are -fold ± S.E (*p < 0.05 EV vs. TUSC3, Two-way ANOVA, n = 3). E., TUSC3 is lost in a subset of CRCs. Tissue microarrays (TMAs) with tumor specimens from CRC patients (n = 306) were stained by immunohistochemistry (IHC). Representative images: (a) TUSC3 negative tumor cells [score 0] with black arrow marking TUSC3+ blood-derived plasma cells (positive control); (b-d) TUSC3+ tumor cells [(b) score 1, (c) score 2, (d) score 3] and stroma. F., Kaplan-Meier-Survival-Analysis. TUSC3 protein expression and its correlation to prognosis (Supplementary Table S1-S3) and clinical factors (Table S4) was calculated. Combined scores for the intensity and frequency of TUSC3 staining in tumor and stroma tissue are expressed as: 0 = negative (0-25 %), 1+ = weak positive (25-50%), 2+ = moderate positive (50-75 %), 3+ = strong positive (75-100 %). Node negative (N0) patients with low (scores 0-1) TUSC3 expression have a reduced overall survival (OS) probability compared with patients showing high (scores 2-3) TUSC3 expression (n = 135, *p = 0.035, log rank test).

