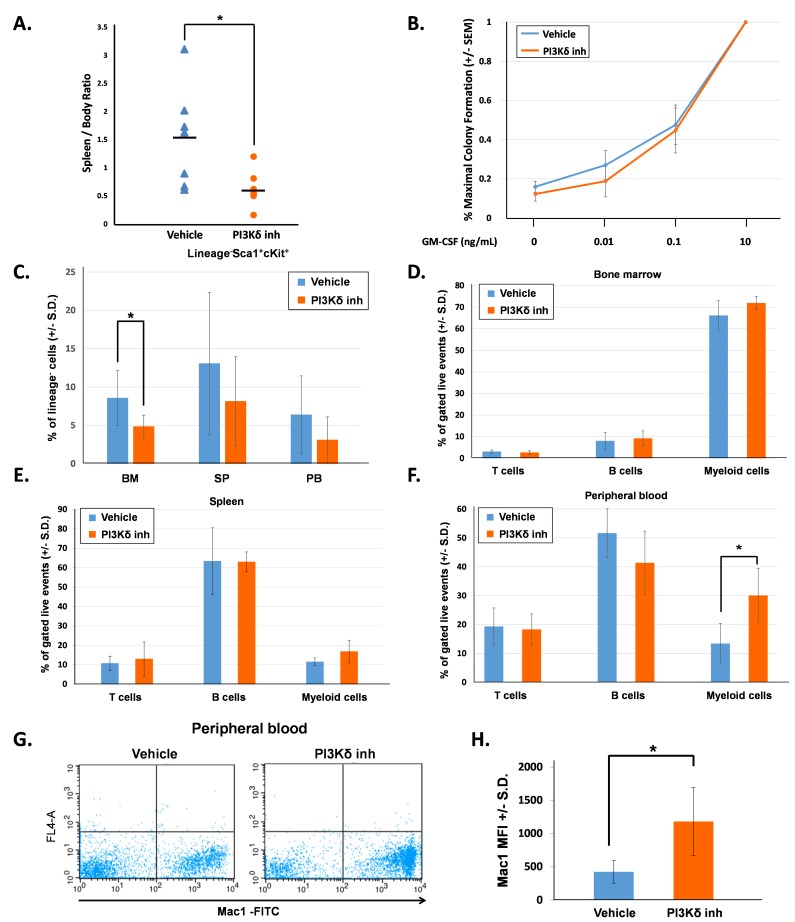
Figure 1. PI3K p110δ inhibition in vivo decreases splenomegaly and promotes myeloid cell maturation.
A. The spleen to body weight ratio of mice at the end of 21 days of treatment, n = 7 per group, *p = 0.03 comparing PI3Kδ inhibitor-treated mice to vehicle-treated mice, statistical analyses performed by unpaired, two-tailed, Student’s t-test. B. Number of colonies formed in methylcellulose colony forming assays, shown as a percentage of total colonies at maximum GM-CSF concentration. Bone marrow LDMNCs were collected and plated in triplicate per each concentration of GM-CSF. Colonies were counted 7 days after plating. C. Average percentage of Lin-Sca1+Kit+ (LSK) cells in bone marrow (BM), spleen (SP), and peripheral blood (PB), n = 7 per group, *p = 0.026 comparing LSK cells in the bone marrow of PI3Kδ inhibitor-treated mice to vehicle-treated mice, statistical analyses performed by unpaired, two-tailed, Student’s t-test. D. Average percentage of bone marrow T cells (CD4+, CD8+), B cells (B220+), and myeloid cells (Gr1+, Mac1+) gated on live events, n = 7 per treatment group. E. Average percentage of spleen T cells (CD4+, CD8+), B cells (B220+), and myeloid cells (Gr1+, Mac1+) gated on live events, n = 7 per treatment group. F. Average percentage of peripheral blood T cells (CD4+, CD8+), B cells (B220+), and myeloid cells (Gr1+, Mac1+) gated on live events, n = 7 per treatment group, *p = 0.05 comparing the percentage of myeloid cells in the peripheral blood of PI3Kδ inhibitor-treated mice to vehicle-treated mice, statistical analyses performed by unpaired, two-tailed, Student’s t-test. G. Representative flow cytometry diagrams showing Mac1 brightness in the peripheral blood of vehicle-treated and PI3Kδ inhibitor-treated mice. H. Average Mac1 mean fluorescent intensity (MFI) in peripheral blood, n = 7 per group, *p = 0.0029 comparing PI3Kδ inhibitor-treated to vehicle-treated mice, statistical analyses performed by unpaired, two-tailed, Student’s t-test.

