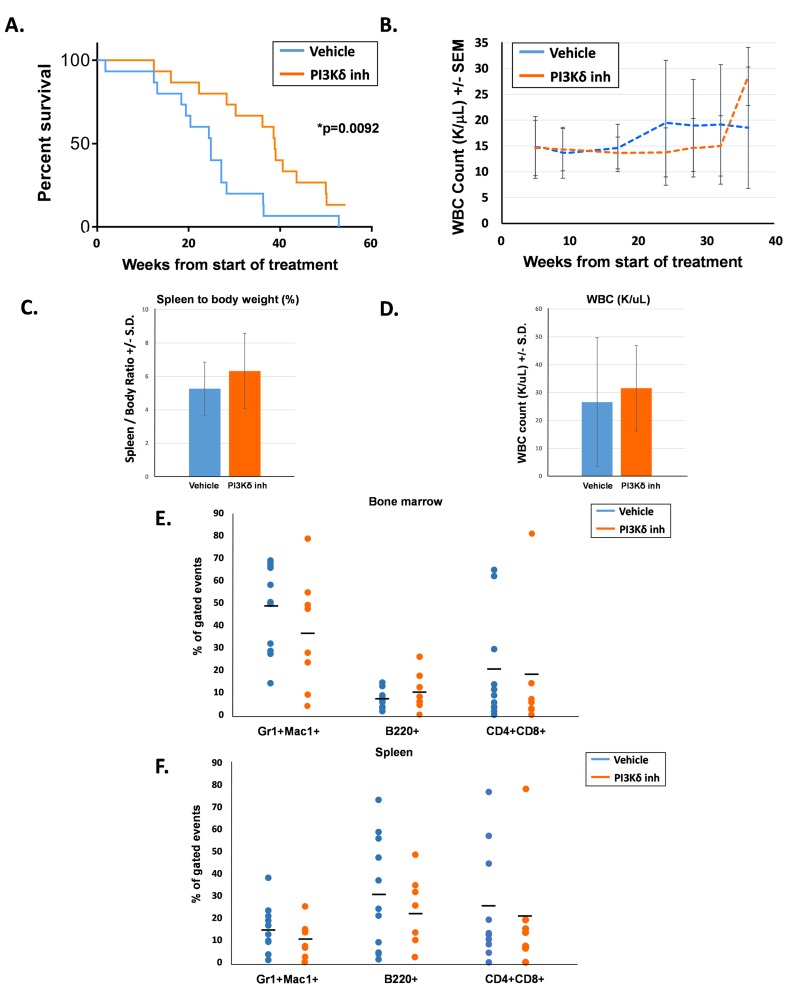
Figure 2. PI3Kδ inhibitor-treated mice had significantly prolonged survival compared to vehicle-treated mice.
A. Kaplan-Meier survival curve of days elapsed from start of treatment until death, n = 15 per treatment group, *p = 0.0092 comparing survival after treatment for PI3Kδ inhibitor-treated mice and vehicle-treated mice, statistical analyses performed by log-rank (Mantel-Cox) test. B. Average WBC count (K/uL) in peripheral blood of mice. C. Average spleen to body weight percentage at the time of death. D. Average WBC count (K/uL) in peripheral blood at the time of death. E. Percentage of bone marrow T cells (CD4+, CD8+), B cells (B220+), and myeloid cells (Gr1+, Mac1+) at the time of death, gated on live events. F. Percentage of spleen T cells (CD4+, CD8+), B cells (B220+), and myeloid cells (Gr1+, Mac1+) at the time of death, gated on live events.

