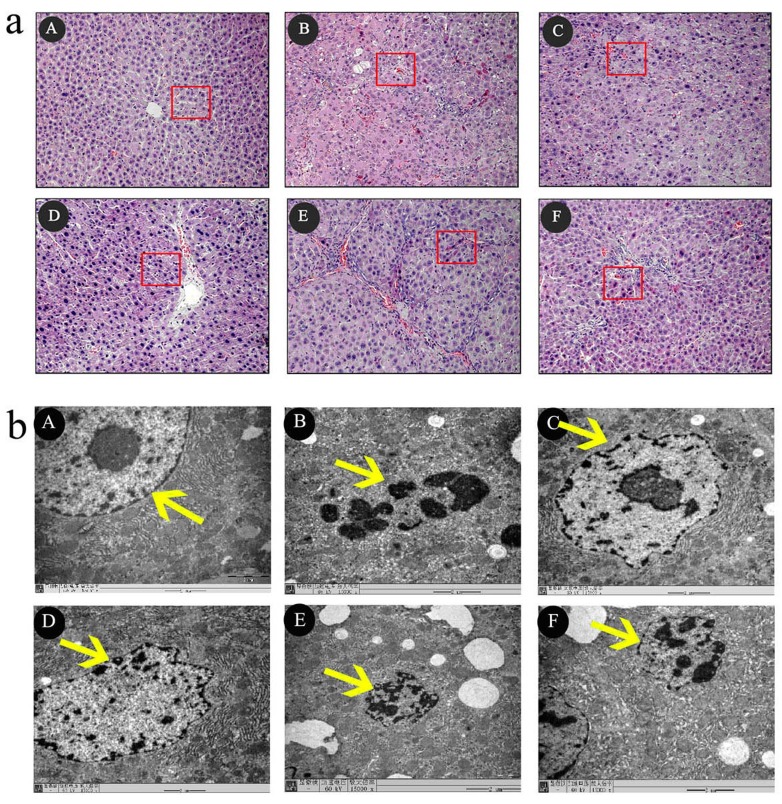
Figure 3. The effects of SHYCD for ACLF on the Histological and Ultrastructural changes in the liver tissue.
a. Representative microscopic images of HE stain. 200x b. TEM images of ultrathin sections of myocardial tissue are changed,15000x. A: control group;B:Model group; C:SHYCD-H group; D: SHYCD-M group; E: SHYCD-L group; F:AGNHW group.

