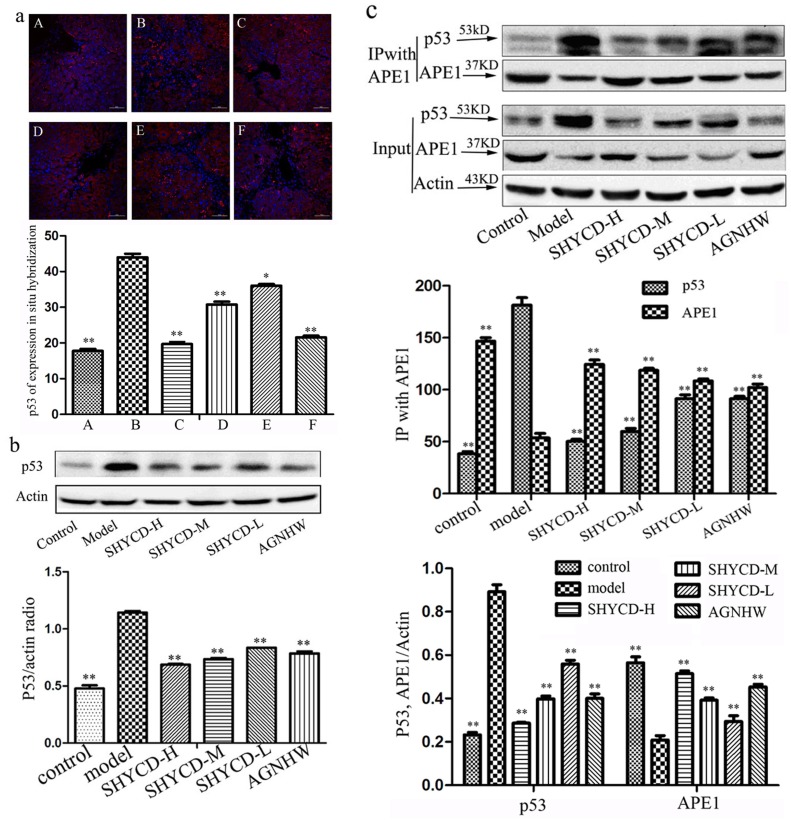
Figure 5. APE1 interaction with P53.
a. Confocal immunofluorescence microscopy image of p53 in situ hybridization (400x). A: control group; B: model group; C:SHYCD-H group; D: SHYCD-M group; E: SHYCD-L group; F:AGNHW group,*p < 0.05; **p < 0.01,VS model. b. Western blot analysis of p53 expression,*p < 0.05; **p < 0.01,VS model. (c) IP performed with an anti-APE1 antibody. Co-IP P53 and APE1 were detected by Western blot.

