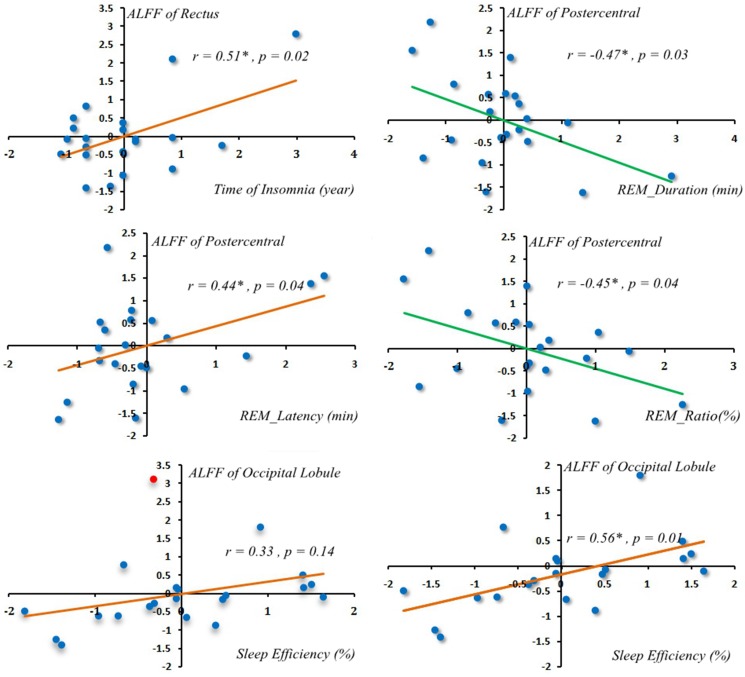
Figure 2. Correlations of regional ALFF alterations with PSG.
One patient occipital lobule ALFF Z value more than 3 (the red spot indicated ALFF Z value more than 3 in the left scatterplot at the bottom row). Occipital lobule showed positive correlation with sleep efficiency after that abnormal ALFF Z value removed (Pearson correlation = 0.56, p = 0.01) (in the right scatterplot at the bottom row).

