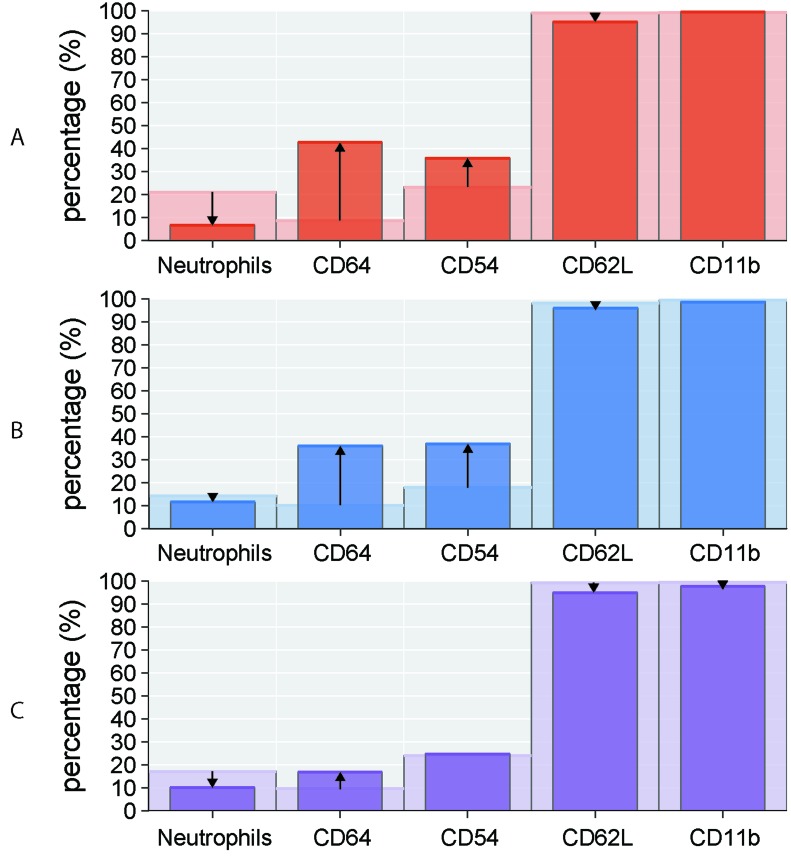
Figure 3. Percentage of circulating neutrophils and surface markers (CD64, CD54, CD62L, CD11b) in CLL subgroups.
Comparison of studied parameters (medians) between A. non-active (light red columns) vs active (dark red columns) disease, B. untreated (light blue columns) vs treated (dark blue columns) disease, C. mutated (light violet columns) vs unmutated (dark violet columns) IGHV gene status. The arrows indicate the increase/decrease in studied parameters in non-active/untreated/mutated CLL subgroups compared to active/treated/unmutated subgroups, respectively.

