
Figure 2. ROC curves were used to determine the cutoff score for the expression of Ano1 in breast cancer patients.
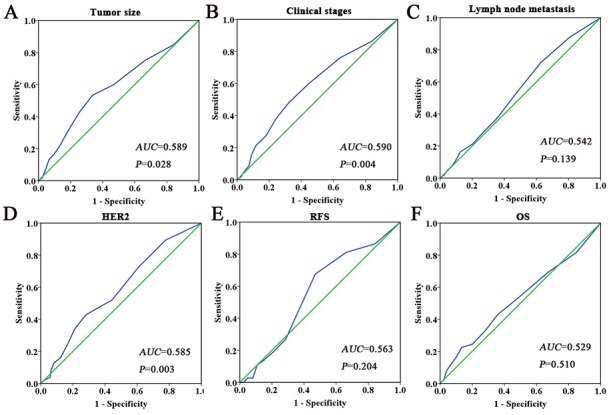
The sensitivity and specificity for histological grade (A), clinical stage (B), lymph node metastasis (C), PR status (D), TNBC status (E), Ki67 status (F), tamoxifen treatment (G), and OS (H) were plotted for the expression of Ano1. The areas under curves (AUC) and P values were indicated.