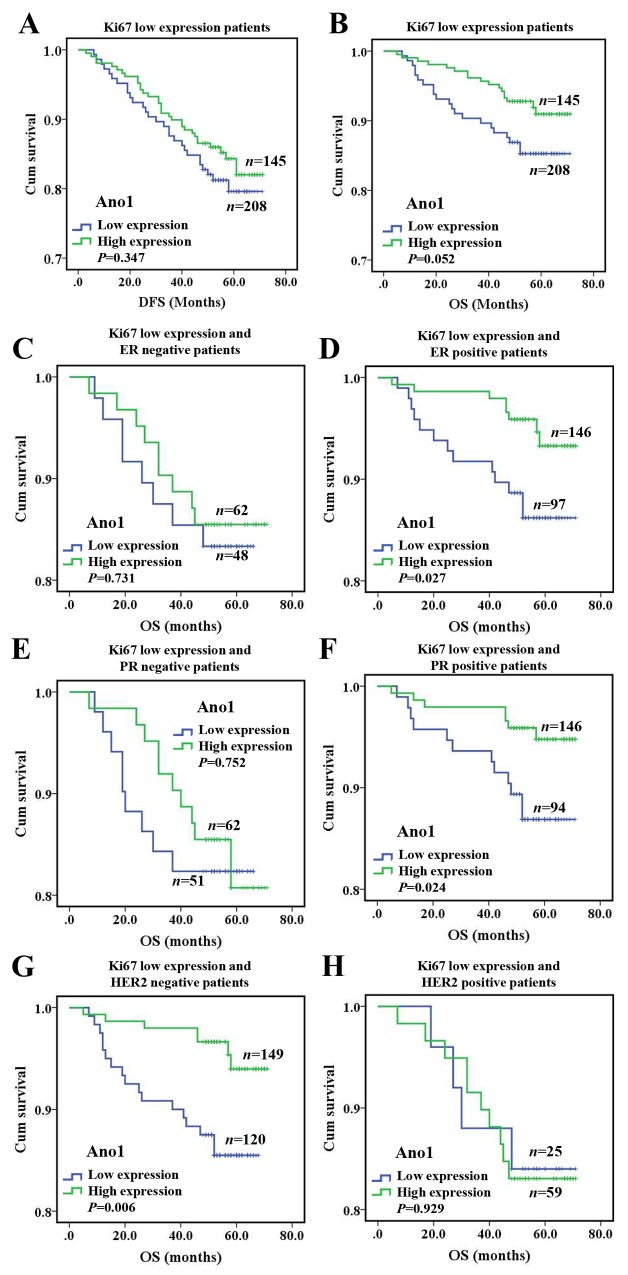
Figure 4. Kaplan-Meier survival analysis of Ano1 expression in breast cancer patients with the low expression of Ki67.
(A, B) Survival curves show the association between Ano1 expression and DFS (A) and OS (B) in 353 breast cancer patients with the low expression of Ki67. C-H. Survival curves show the association between Ano1 expression and OS in ER-negative patients (C), ER-positive patients (D), PR-negative patients (E), PR-positive patients (F), HER2-negative patients (G), and HER2-positive patients (H).

