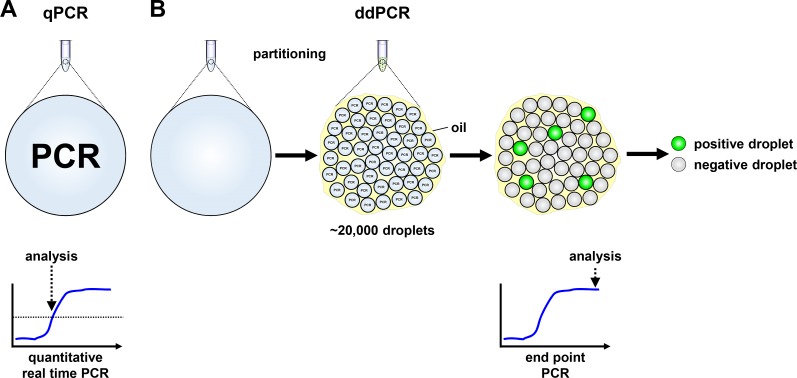
Figure 1. Schematic models of quantitative real-time and droplet digital PCR.
(A) Signal detection in quantitative real-time PCR (qPCR) is provided in a single reaction, measured in real-time and analyzed from the exponential phase of the reaction. (B) Droplet digital PCR (ddPCR) reaction reagents are partitioned into ∼20,000 droplets before PCR reactions proceed to the reaction plateau end point in individual droplets. Droplets are assessed as positive or negative from their fluorescent signal intensity.

