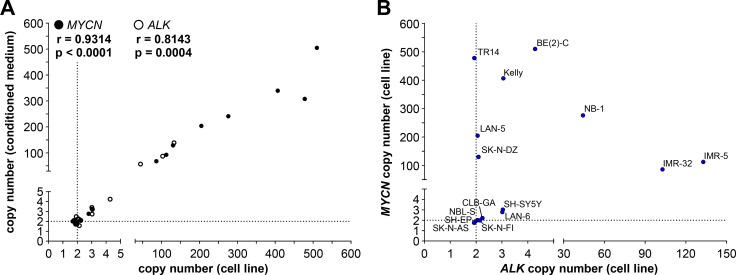
Figure 6. MYCN and ALK copy numbers determined by ddPCR of genomic DNA correlate with copy numbers determined from the corresponding cell-free DNA.
(A) Copy numbers determined by ddPCR from genomic DNA from each cell line is plotted on the x-axis and copy numbers determined by ddPCR from the corresponding cell-free DNA isolated from conditioned medium is plotted on the y-axis. Values presented in Figures 4 and 5 were used. Significance of the correlation between the 2 DNA sources for determining MYCN (black circles) and ALK (white circles) copy numbers was assessed from the plot, and the Spearman correlation coefficient (r) and p-value are indicated. Dashed lines indicate the position of diploid gene status. (B) Plotting MYCN copy numbers against corresponding ALK copy numbers divided neuroblastoma cell lines into different groups based on combined copy number status. MYCN copy numbers determined by ddPCR from genomic DNA from the indicated cell lines are plotted along the y-axis against ALK copy numbers determined by ddPCR from genomic DNA from the same cell lines (x-axis). Same values as those plotted in A are used. Dashed lines indicate the position of diploid gene status.

