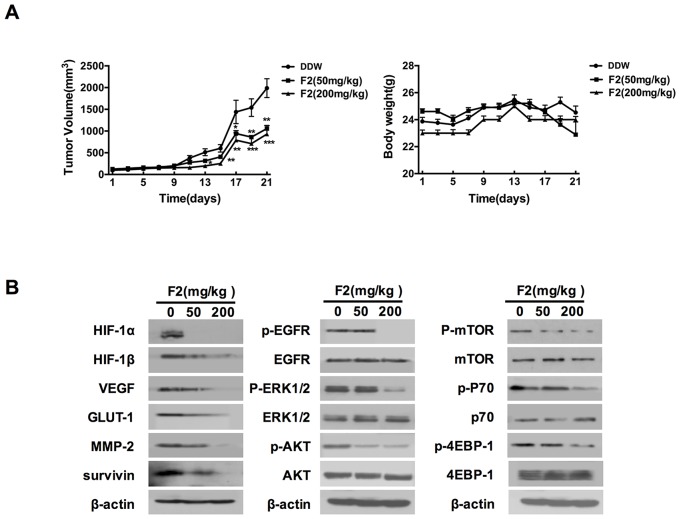
Figure 7. The effects of F2 on tumor growth and the HIF-1 pathway in vivo.
(A) Relative tumor volume and body weight in U87 xenograft mice treated with F2 (mg/kg i.g.). Values are means ± SE of three experiments. ** P<0.01 and **P<0.001 compared with control group. (B) Western blot analysis of HIF-1α, proteins encoded by HIF-1 target genes and proteins related to the EGFR signaling pathway in tumors from U87 xenograft mice treated with or without the indicated concentrations of F2 (mg/kg i.g.).

