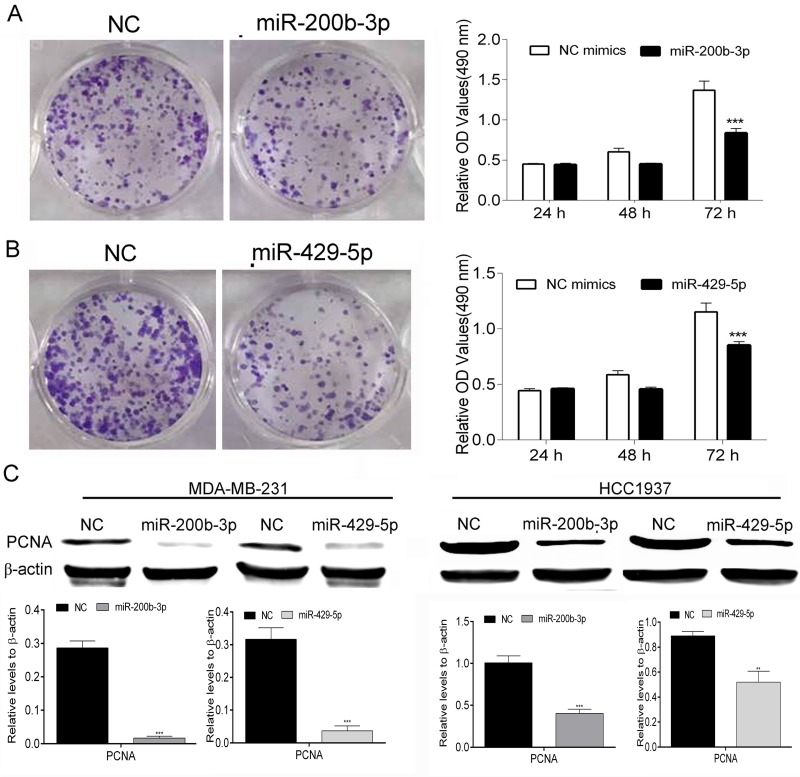
Figure 2. MiR-200b-3p and miR-429-5p suppressed proliferation of TNBC cells.
(A) Representative colony-formation assays and results of MTT assays showing that transfection with miR-200b-3p mimics suppressed the proliferation of MDA-MB-231 TNBC cells. (B) Representative colony-formation assays and results of MTT assays showing that transfection with miR-200b-3p mimics suppressed the proliferation of TNBC cells (One-way ANOVA analysis of variance; miR-200b-3p and miR-420-5p vs NC, p < 0.001). (C) Representative Western blots showing that miR-200b-3p and miR-429-5p inhibited the expression of PCNA in MDA-MB-231 and HCC1937 TNBC cells. NC, negative control; OD, optical density. Three independent experiments were performed. Numbers of colony or gray scale images of each assay were counted or scanned and presented as a bar chart in which the vertical axis is the mean ± SD. *** indicates statistical differences at p < 0.001.

