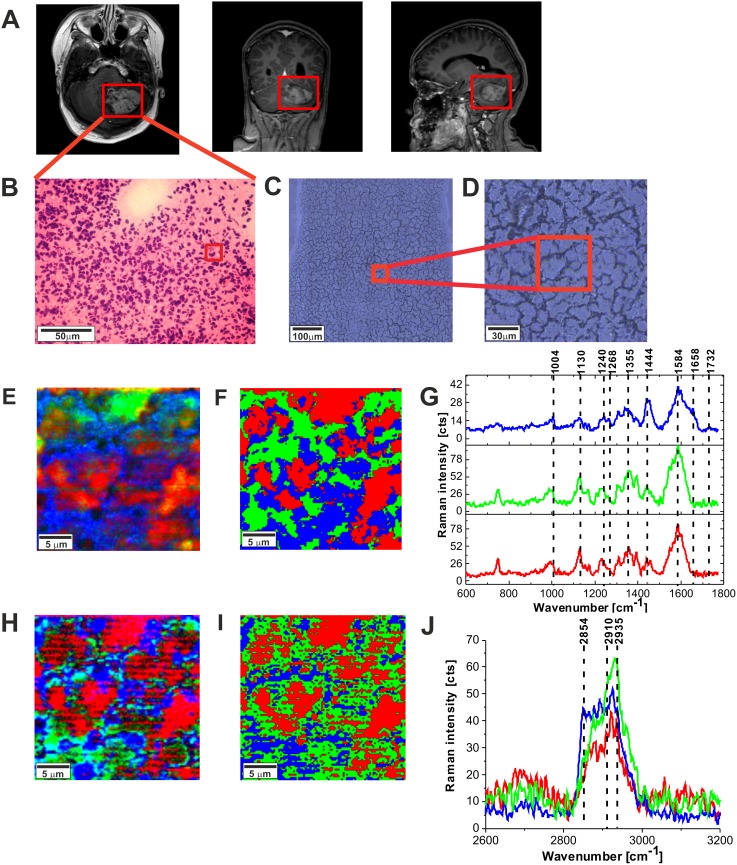
Figure 5.
The MRI image (A), H&E-stained histological image (B), stitching microscopy image (520 μm x 520 μm) (C), microscopy image (155μm x 155 μm) (D) Raman images (50 μm x 50 μm) obtained by basis analysis (E) and cluster analysis (F) and the characteristic vibrational Raman spectra in the fingerprint frequency region (G) Raman images (50 μm x 50 μm) obtained by basis analysis (H) and cluster analysis (I) and the characteristic vibrational Raman spectra in the high frequency region (J) of the tumor CNS (medulloblastoma, grade WHO IV, infratentorial. Left cerebellar hemisphere) (P9), The line colors of the spectra correspond to the colors of the Raman maps. Raman integration time for images 0.5 s, resolution step: 1 μm, laser excitation power: 10m W.

