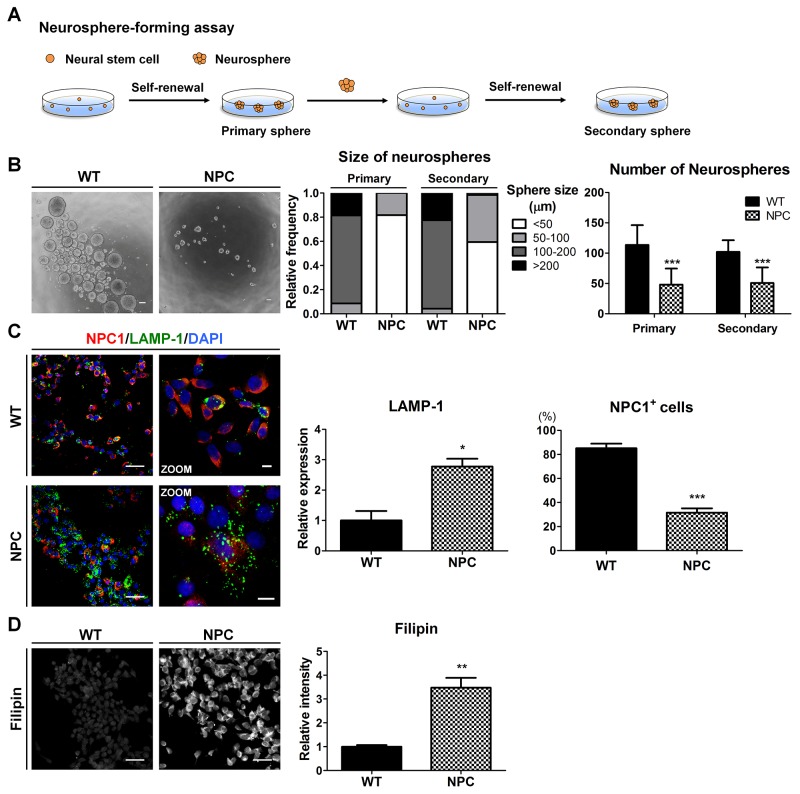
Figure 3. NPC-iNSCs display disease-specific phenotypes of NPC disease.
(A) Scheme of neurosphere-forming assay. (B) Phase-contrast images of the WT- and NPC-neurospheres (left), scale bar = 100 μm. Self-renewal ability is characterized by the diameter (middle) and number (right) of primary and secondary neurospheres. (C) WT- and NPC-iNSCs were stained with antibodies against NPC1 and LAMP-1. Nuclei were counterstained with DAPI,scale bar = 50 μm, zoom scale bar = 10 μm. The quantification of NPC1-postivie cells was conducted following the same method used in Figure 2C. The expression levels of LAMP-1 was measured using Image J software and the value of control is set at 1. (D) Unesterified cholesterol of WT- and NPC-iNSCs was detected by filipin staining, scale bar = 50 μm. *P < 0.05, **P < 0.01, ***P < 0.005.

