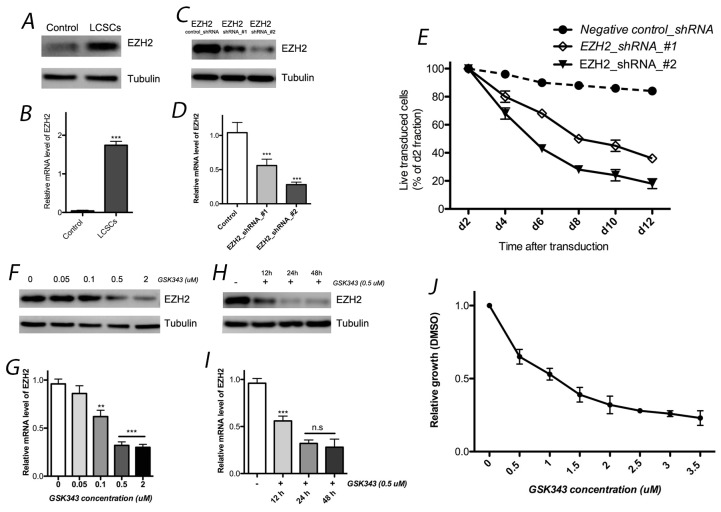
Figure 1. EZH2 expression in LCSCs.
EZH2 expression in LCSCs by western blotting (A) and real-time quantitative RT-PCR (B) analyses. Both EZH2 shRNAs significantly decreased EZH2 expression in LCSCs at the protein (C) and mRNA (D) levels; (E) effects of EZH2_shRNA on cell growth of LCSCs; EZH2 protein (F) and mRNA (G) expression was affected by different concentration of GSK343; effect of GSK343 with different incubation time were also observed by western blotting (H) and real-time quantitative RT-PCR (I) analyses; (J) cell viability was evaluated after 4 days of incubation with GSK343. Each experiment was performed independently at least 3 times. Each experiment was performed in triplicate, ***P < 0.001, **P < 0.01, *P < 0.05.

